Ethereum Faces an Uphill Battle: Can It Overcome the Challenges?
Ethereum price extended its decline and tested the $3,720 support. ETH is now consolidating and facing many hurdles near the $3,800 level. Ethereum extended its decline and tested the $3,720 zone. The price is trading be...
Archive context
Older archive item. Useful for background and entity history, but not a fresh market-moving signal.

Ethereum price extended its decline and tested the $3,720 support. ETH is now consolidating and facing many hurdles near the $3,800 level.
- Ethereum extended its decline and tested the $3,720 zone.
- The price is trading below $3,820 and the 100-hourly Simple Moving Average.
- There is a new bearish trend line forming with resistance at $3,810 on the hourly chart of ETH/USD (data feed via Kraken).
- The pair could continue to move down if it breaks the $3,720 support.
Ethereum price remained in a short-term bearish zone and declined below the $3,800 support zone, like Bitcoin. ETH even traded below the 50% Fib retracement level of the upward move from the $3,631 swing low to the $3,975 high.
However, the bulls were active near the $3,720 support zone. They protected the 76.4% Fib retracement level of the upward move from the $3,631 swing low to the $3,975 high.
Ethereum price is now trading below $3,800 and the 100-hourly Simple Moving Average. If there is a fresh increase, ETH might face resistance near the $3,800 level. There is also a new bearish trend line forming with resistance at $3,810 on the hourly chart of ETH/USD.
The first major resistance is near the $3,850 level. An upside break above the $3,850 resistance might send the price higher. The next key resistance sits at $3,890, above which the price might gain traction and rise toward the $3,950 level.
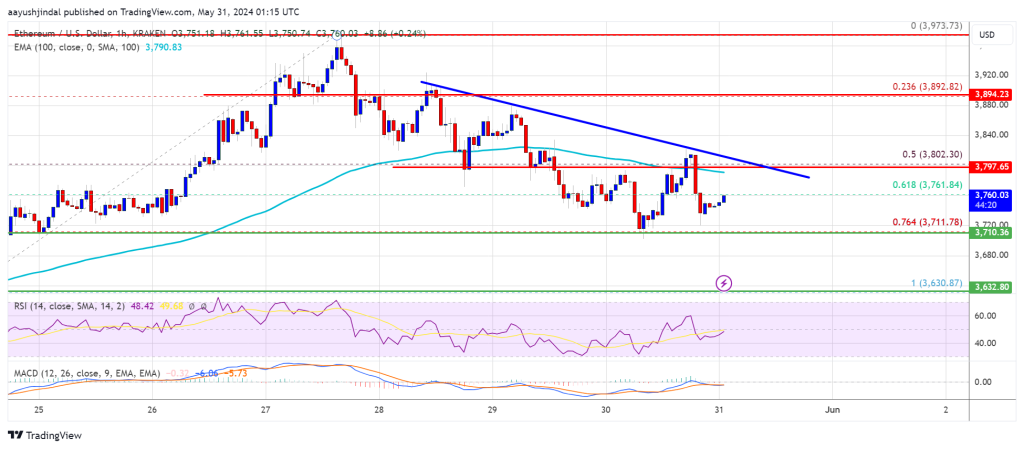
If the bulls push Ether above the $3,950 level, the price might rise and test the $4,000 resistance. Any more gains could send Ether toward the $4,080 resistance zone.
More Losses In ETH?If Ethereum fails to clear the $3,800 resistance, it could continue to move down. Initial support on the downside is near the $3,720 level.
The next major support is near the $3,640 zone. A clear move below the $3,640 support might push the price toward $3,550. Any more losses might send the price toward the $3,500 level in the near term.
Technical Indicators
Hourly MACD – The MACD for ETH/USD is losing momentum in the bearish zone.
Hourly RSI – The RSI for ETH/USD is now below the 50 zone.
Major Support Level – $3,720
Major Resistance Level – $3,800
Why this matters
This ethereum story adds another data point to the current market tape and is useful when read alongside nearby source coverage.
Original source
Read on NewsBTCRelated market context

Ethereum (ETH) Price Prediction: Bulls and Bears Face Off as $3,000 Rally Meets Liquidation Risk
Ethereum price is entering a volatile phase after its latest recovery, with buyers trying to defend the recent breakout while sell...

Ethereum Price Prediction: ETH Finally Breaks the Bear Pattern
Ethereum price trades at $2,675 after clearing a bull-flag structure that had capped its bullish prediction for weeks. The breakou...

Microsoft Copilot AI Predicts Bitcoin Will Do Something Incredible in Q4 2026
Microsoft Copilot AI predicts a wild move for BTC in Q4 2026, calling it one of the strongest asymmetric risk-reward positions ava...

Ethereum Slips Against Sterling as ETH/GBP Rate Holds Near £2,018
Ethereum trades at £2,017.54 per ETH against the pound, down 1.02% in a day. What the ETH/GBP rate move means for UK holders and c...

XRP Price Prediction: Weekly Gains Lead Crypto Market, But Can XRP Clear $1.63?
XRP price trades at $1.53, up by a marginal 1.5% on the day, and is still sitting on one of the strongest weekly charts among larg...

US crypto ETFs draw over $3 billion this week, with nearly $800 million flowing beyond Bitcoin
US crypto exchange-traded funds have pulled in more than $3 billion this week as fresh demand spread beyond Bitcoin into Ethereum...