Ethereum Faces Resistance Against Bitcoin – ETH/BTC Bullish Structure In Question
After a strong rally that pushed Ethereum to a local high of $2,730, the asset has retraced over 10%, now testing key support levels as the market cools off. The correction comes after days of heavy buying pressure and g...
Archive context
Older archive item. Useful for background and entity history, but not a fresh market-moving signal.

After a strong rally that pushed Ethereum to a local high of $2,730, the asset has retraced over 10%, now testing key support levels as the market cools off. The correction comes after days of heavy buying pressure and growing expectations of a broader altseason. However, the recent pullback has sparked debate among analysts and traders, with sentiment now split between those anticipating another leg up and others preparing for a deeper correction.
Some believe this pause is healthy and necessary before Ethereum resumes its uptrend. Others argue that ETH could retest lower zones, especially if Bitcoin remains range-bound. Top analyst Daan weighed in by highlighting the ETH/BTC pair, pointing out that Ethereum, after its big move up, is now facing resistance around the 0.026 BTC level.
With Ethereum still trading far below its all-time high and caught in a wide macro range, the coming days may prove decisive. Whether this is just a short-term cooldown or the start of a larger correction, Ethereum’s current levels will likely dictate the momentum heading into the next phase of the market.
Ethereum Holds Critical Support As ETH/BTC Pair Faces Key ResistanceEthereum continues to show resilience despite recent volatility, maintaining its position above the $2,400 level. This zone now acts as crucial support, and bulls must defend it to preserve the broader bullish momentum. While price action has cooled slightly following its sharp run to $2,730, ETH remains one of the stronger performers in the market, holding up well amid increased uncertainty and speculative positioning.
Much of the current optimism hinges on Ethereum’s performance relative to Bitcoin. If ETH continues to outperform BTC, analysts believe it could trigger the long-awaited altseason — a market phase where altcoins significantly outperform Bitcoin. Daan shared insights on this dynamic, focusing on the ETH/BTC ratio, which has gained notable strength in recent sessions.
According to Daan, ETH has now run into resistance near the 0.026 level after a sharp rally. For bullish momentum to continue, ETH must hold above 0.0224. A break below this key support could trigger a slow bleed and potentially unwind the entire recent move. On the upside, a clear break above 0.026 would open the door to a move toward 0.03 and beyond.
In short, Ethereum’s short-term direction will likely be shaped by its ability to hold $2,400 and maintain strength against Bitcoin. If both conditions are met, the case for a sustained altcoin rally grows significantly stronger.
ETH Pulls Back Into Support After Failing To Break $2,700Ethereum is currently trading at $2,485, following a sharp retracement from its recent local high near $2,730. The chart shows that ETH failed to hold above the 200-day simple moving average (SMA) at $2,701, which acted as a strong resistance zone. After days of sustained upward momentum, this rejection has pushed the price back toward the 200-day exponential moving average (EMA) around $2,438 — a key level that now serves as immediate support.
Volume has remained elevated during this move, suggesting active participation from both bulls and bears. Despite the rejection from the 200 SMA, Ethereum is still holding well above its breakout zone from early May, where the price surged from under $2,000. If bulls can defend the EMA and keep price above $2,400, this could form a higher low and set the stage for another attempt at reclaiming the $2,700–$2,800 area.
However, if ETH loses the $2,400 level, momentum could shift in favor of the bears, potentially triggering a larger correction. For now, Ethereum remains in a consolidation phase within a broader bullish structure. The next few daily closes will be critical to confirm if the pullback is healthy or a signal of deeper weakness.
Featured image from Dall-E, chart from TradingView
Why this matters
This ethereum story adds another data point to the current market tape and is useful when read alongside nearby source coverage.
Original source
Read on NewsBTCRelated market context

ETH USD Loses Ground as Ethereum Price Analysis Remains Targeting $3,000 This Week
Ethereum Price Prediction, September 23: Ethereum (ETH) trades at $2,735, down a marginal 0.61% over the past 24 hours, a pause, n...

XRP Price Today: XRP Hits $1.60 as Heavy Whale Accumulation Points to a $2 Rally and Beyond
The XRP price reached $1.6060 on September 23 after opening near $1.5808, according to historical market data. The token subsequen...

Solana moves Alpenglow into testnet as SOL nears January highs
Solana has begun rolling out Alpenglow on testnet, moving its planned blockchain consensus overhaul into a public testing environm...

Can Ripple Crack $1.80? XRP Price Prediction Says This Week
XRP Price Prediction: Ripple (XRP) trades at $1.59 as of this writing, up 1.6% on the day, with a 24-hour range spanning $1.5577 t...

Bitcoin slips below $85,000 as 5% Treasury yield returns to haunt risk assets
Bitcoin fell below $85,000 on Sept. 23 after stronger-than-expected US business activity sent Treasury yields higher and flushed l...
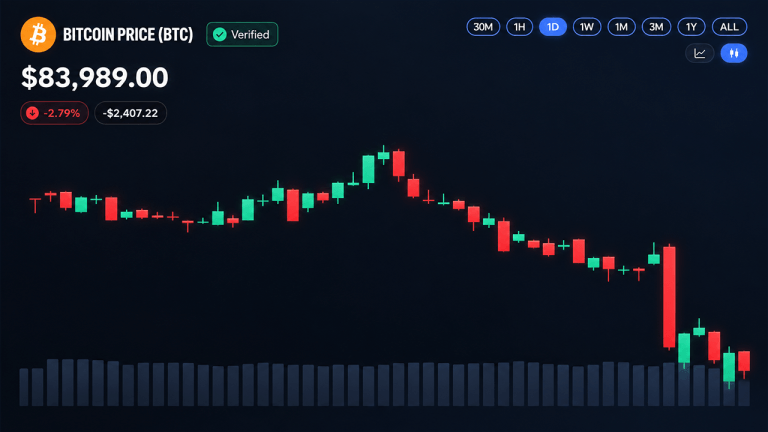
Bitcoin Price Plunges Below $84K as Rally Snaps
Bitcoin’s rally abruptly ended as its price dropped below $84,000, reaching an intraday low of $83,508 shortly after failing to ho...