Ethereum: Historical Playbook Points To $3,800 In Coming Months
Renowned analyst Josh Olszewicz has shared some compelling insights on Ethereum’s price trajectory. Drawing parallels from historical patterns, Olszewicz’s analysis suggests that Ethereum might be gearing up for a signif...
Archive context
Older archive item. Useful for background and entity history, but not a fresh market-moving signal.

Renowned analyst Josh Olszewicz has shared some compelling insights on Ethereum’s price trajectory. Drawing parallels from historical patterns, Olszewicz’s analysis suggests that Ethereum might be gearing up for a significant rally in the coming months.
Historical Pattern: Ethereum Forms Ascending TriangleOlszewicz starts by highlighting Ethereum’s current price pattern, jokingly stating, “Ethereum: ascending triangle 450 million years in the making w/fib extensions to $3k.” This ascending triangle, characterized by a flat top and rising bottom, has been forming since May 2022, and if history is any guide, it could be a bullish sign for Ethereum.
Descending volume, another feature of this pattern, further strengthens the bullish bias. However, Olszewicz cautions that the “bias remains bullish until price breaks below diagonal support.” He also points out the psychological resistance at $2,000, noting it as an “extremely obvious signal that it’s go time, which should help the breakout.”
To bolster his analysis, Olszewicz draws parallels from Bitcoin’s past. He recalls, “take BTC in 2015/2016 [the price formed an ascending triangle for 210 days with descending volume] and BTC in 2018/2019 [ascending triangle for 130 days with descending volume] as examples.” In both instances, Bitcoin surged towards the Fibonacci extension levels post the breakout.
Ethereum itself isn’t a stranger to such patterns. Olszewicz cites, “ETH has also had previous examples in 2017 (bullish continuation) and 2019 (bullish reversal).” Each ascending triangle pattern lasted 180 days. Both times ETH surged towards the 2.618 Fibonacci extension level.
Drawing from these historical patterns, Olszewicz suggests that Ethereum is currently holding the potential to overshoot the 1.618 Fibonacci level and possibly reach the 2.618 level, which translates to a price of $3,800. However, he wisely advises, “but don’t get out the imaginary profit calculator just yet, let’s break $2k first.”
ETH vs. BTC: Which One Is The Better Trade?While Ethereum’s potential rally is intriguing, Olszewicz also delves into its performance relative to Bitcoin. He observes that Ethereum has underperformed Bitcoin year-to-date, attributing this to the ETF narrative and Bitcoin’s dominance as hard money. He speculates, “the better trade may continue to be BTC/USD, especially with initial spot ETF inflows favoring BTC.”
However, if the ETH/BTC pair can break and sustain new highs, it might hint at a runaway trade for Ethereum. But Olszewicz remains skeptical, stating it’s “unlikely based on ETF flows.”
Olszewicz also doesn’t shy away from discussing potential bearish scenarios. He’s closely watching certain bearish ETH/BTC levels, including the current local low at 0.050 and the previous inverse head and shoulders neckline at 0.039.
For Bitcoin, he suggests a potential move to $42,000, provided it maintains certain bullish conditions. He notes, “as long as we can maintain prices above the midline of the PF & stay in the cloud, we have a decent shot at reaching $42k before halving.”
Wrapping up his analysis, Olszewicz envisions a dream trade where Bitcoin breaks bullish first, possibly due to technicals or a spot ETF approval. In this scenario, Ethereum breaks $2,000 but lags behind Bitcoin, leading to ETH/BTC getting “crushed, allowing for an eventual profit taking rotation from Bitcoin to Ethereum”. However, he concludes with a word of caution: “without inflows, we ain’t movin.”
At press time, ETH traded at $1,860.
Why this matters
This ethereum story adds another data point to the current market tape and is useful when read alongside nearby source coverage.
Original source
Read on NewsBTCRelated market context

Elon Musk Grok AI Predicts a Bold Move for Ethereum in 2026
When prompted, the Elon Musk-backed Grok AI predicts a bold move for Ethereum (ETH) over the remainder of 2026. It claims that if...

Claude AI Predicts XRP Could Hit $10 in 2026: How Does it Get There
In ideal bull-market conditions, Anthropic’s Claude AI predicts Ripple (XRP) could hit $10, assuming sustained liquidity, expandin...

Ripple CEO Brad Garlinghouse Says XRP and Solana Can Both Thrive in Crypto’s Next 5 Years
Garlinghouse’s comments have resurfaced as XRP and Solana both trade near important technical levels following recent gains. “I’m...

Vitalik Buterin outlines Ethereum’s ambitious roadmap to 2030
Ethereum's ambitious roadmap could redefine its scalability and security, potentially boosting long-term market confidence and val...

Ethereum is not instant, but collateral could make it feel that way
When a payment app tells you a transfer is complete, you start making decisions. You hand over whatever you've sold, spend the mon...
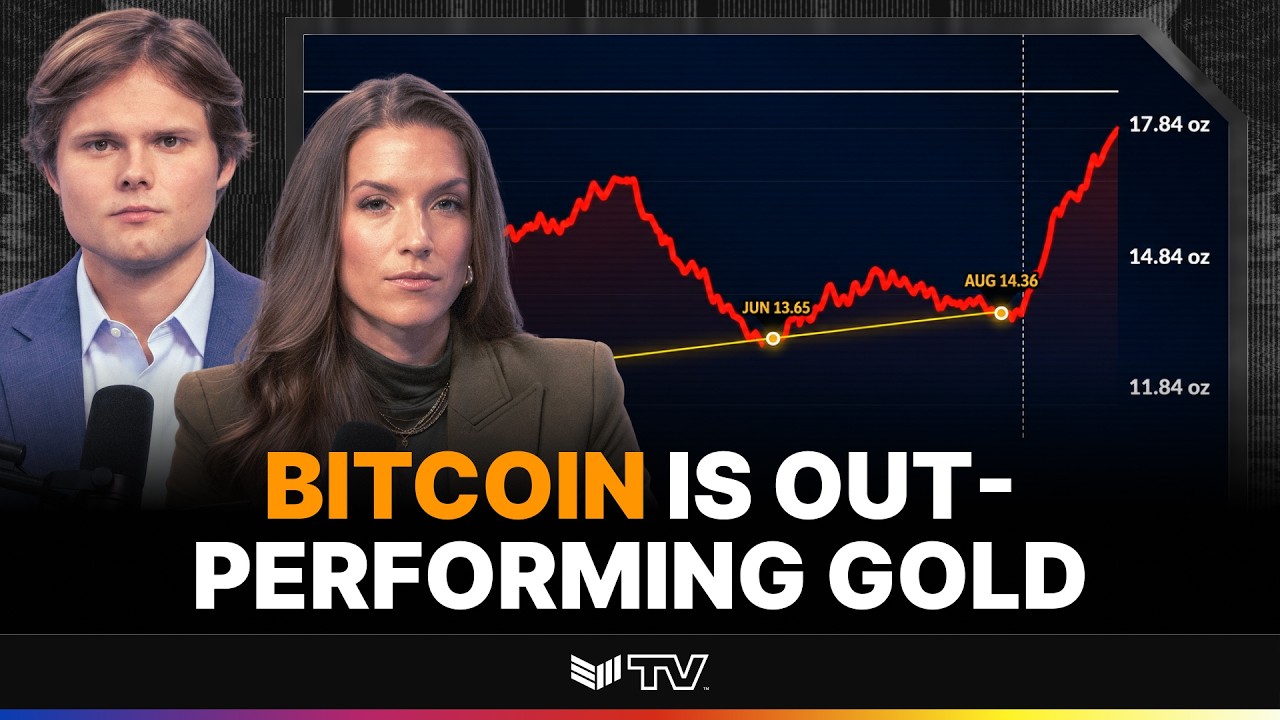
TECHNICAL ANALYSIS: BTC to Cross Key Price Level Against Gold
Bitcoin Magazine TECHNICAL ANALYSIS: BTC to Cross Key Price Level Against Gold The 90-day correlation between Bitcoin and gold jus...