Ethereum In Tight Range – Will Selling Pressure Push ETH Below $1,250?
Ethereum, the undisputed ruler of the altcoin market, is now stuck in a bear market as the token struggles to break the $1,300 resistance level. However, the current market price is $1,302.87, only 0.22 percent more than...
Archive context
Older archive item. Useful for background and entity history, but not a fresh market-moving signal.

Ethereum, the undisputed ruler of the altcoin market, is now stuck in a bear market as the token struggles to break the $1,300 resistance level. However, the current market price is $1,302.87, only 0.22 percent more than the key psychological buy point.
Despite how good this sounds, the way the market is moving right now, the bear market is likely to continue this month, which is not good news for ETH.
The possibilities of a bear market recovery for ETH are slim due to the terrible state of the macroeconomy, according to The Guardian.
In this year’s much-hyped “Uptober,” the token is probably going to experience even more misery than usual. However, what do the graphs show?
Trading In A Tight BandAt the time of writing, the altcoin was expected to trade in a narrow band. Before that, however, the price of ETH has fluctuated over the past 25 days between $1,188 and $1,411. Since this coincides with when the Federal Reserve hiked interest rates, it demonstrates especially tumultuous market conditions at the time.
As previously indicated, Ether is presently following a pennant formation. This pattern is a bearish sign that matches the preceding price action. The price has decreased to $1,300.35, where we anticipate a significant price movement on or near the price level.
Chart: TradingViewWith the current sideways market action, technical analysis is also quite neutral. The momentum indicator demonstrates a sharp decline following the market meltdown on September 13, which was followed by a rebound and leveling from September 21 to the present.
Chaikin’s money flow index, which currently stands at 0.05, is positive, indicating that bulls rule the market. Stochastic RSI values also confirm this strengthening bullish momentum.
As the RSI is close to oversold zone, it strengthens the bullish momentum seen in other technical indicators, giving investors a good buying opportunity.
Ethereum: Price Reversal Likely?Despite the price narrowing to a point, ETH may be repeating the previous July-August rally in which it created three bottoms before rising. As of this writing, the altcoin has already established these three bottoms and may be on the ascent.
Despite this, bulls should continue to be cautious due to the difficult market conditions. If today’s market closes in the green above $1,300, we may witness a rally that tests or breaches the $1,345 level of resistance.
ETHUSD pair trading at $1320 on the weekend chart | Featured image from TradeMap, Chart: TradingView.com Disclaimer: The analysis represents the author's personal views and should not be construed as investment advice.Why this matters
This ethereum story adds another data point to the current market tape and is useful when read alongside nearby source coverage.
Original source
Read on NewsBTCRelated market context

Bitcoin Price Today: Negative Funding Rates Signal Growing Bearish Bets as BTC Nears $68K
The latest data presents a mixed picture, however, as Hyperliquid whales have returned to net-long positions despite deteriorating...

XRP Price Today: $0.98 Support Under Threat Despite Oversold RSI
Deeply oversold indicators suggest a possible relief bounce, but the broader technical structure remains bearish. The XRP price ha...
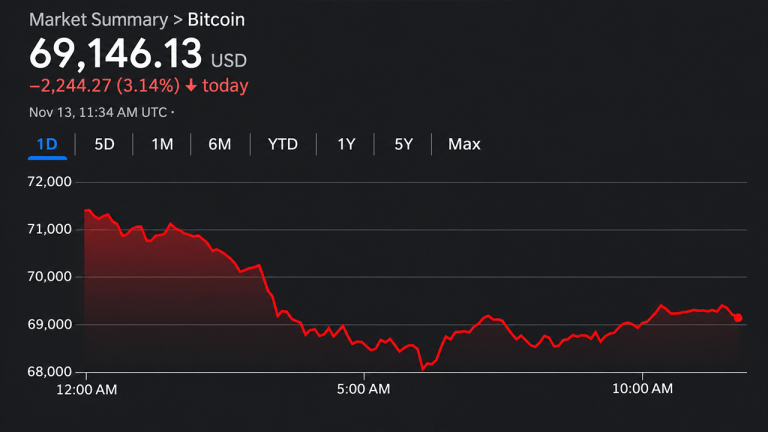
Bitcoin Price Taps $67,500 Intraday Low as Bears Tighten Grip
Bitcoin’s price has deteriorated sharply, with the leading cryptocurrency trading near $69,140 after touching an intraday low of $...

JPMorgan Buys More Strategy and Bitcoin ETF Despite MSCI Saylor Blow
JPMorgan is quietly increasing its Bitcoin exposure while the crypto market is being beaten up. The banking giant raised its Strat...

Bitcoin (BTC) Price Today: $65K Support Under Pressure as Glassnode Maps $60K–$62K Liquidation Cluster
Glassnode’s futures liquidation heat map identifies a concentrated cluster of leveraged long positions between $60,000 and $62,000...

U.S. Wholesale Inflation Hits 6.5%—What It Means for Bitcoin’s Next Move
Bitcoin’s inflation problem has a fresh complication. U.S. wholesale prices rose 6.5% over the year to October, their fastest annu...