Ethereum Longs at Risk? Analyst Warns of Recurring Weekly Liquidation Pattern
Ethereum (ETH) recently broke through to a new all-time high above $4,900 before undergoing a correction. As of now, the asset trades at $4,520, reflecting an 8.9% pullback from its peak but still up 7.6% over the past w...
Archive context
Older archive item. Useful for background and entity history, but not a fresh market-moving signal.

Ethereum (ETH) recently broke through to a new all-time high above $4,900 before undergoing a correction. As of now, the asset trades at $4,520, reflecting an 8.9% pullback from its peak but still up 7.6% over the past week.
The move follows weeks of strong upward momentum that returned ETH to price levels unseen since the 2021 bull cycle. While Ethereum’s long-term trend remains upward, analysts are examining short-term patterns to explain the market’s current volatility.
One such perspective comes from XWIN Research Japan, a contributor to CryptoQuant’s QuickTake platform, highlighting how recurring liquidation cycles are shaping ETH’s price action, particularly around the beginning of each week.
Ethereum’s “Monday Trap” and the Risks of Excessive LeverageAccording to the analysis, Ethereum’s leveraged markets show a recurring rhythm tied to liquidation events. Leveraged long positions, bets that the price will continue rising, have often been caught in sudden reversals, forcing liquidations that amplify downward moves.
During April and June 2025, ETH saw long liquidations spike beyond 300,000 ETH in a single day as sharp downturns triggered cascading sell-offs. XWIN Research Japan noted a striking weekly pattern: Mondays consistently show the highest liquidation volumes, followed by Sundays and Fridays.
In contrast, Saturdays record the lowest, likely due to reduced market activity. This cycle, often referred to as the “Monday Trap,” suggests that traders carrying leveraged positions from the weekend are particularly vulnerable once institutional and retail flows re-enter early in the week.
“Carrying weekend optimism into Monday’s higher-volume sessions is risky,” the analyst observed, emphasizing that short-term leverage magnifies losses in predictable ways.
For long-term investors, this cycle is less about price direction and more about understanding the risks of excessive leverage in a highly liquid market.
Technical Levels and Broader Market OutlookFrom a technical standpoint, Ethereum’s price correction is being closely monitored. A market analyst known as Crypto Patel recently posted on X that ETH has retraced from $4,957 to $4,400, noting $3,900–$4,000 as a strong support zone.
According to Patel, holding this level could open a path toward higher price ranges of $6,000–$8,000. However, if support breaks, downside levels of $3,500 or even $3,200 remain possible.
$ETH Price Analysis
#Ethereum hit ATH of $4957 2 days ago, now retracing to $4400. Strong support at $3900-$4000. Holding this zone opens upside to $6000-$8000. Breakdown of $3900 could lead to $3500 and $3200 levels. pic.twitter.com/WJTdHEImqH
— Crypto Patel (@CryptoPatel) August 26, 2025
The interaction between leveraged liquidations and key technical support levels may define Ethereum’s trajectory in the coming months. Historical data show that large outflows from exchanges often precede sustained rallies, while inflows typically signal selling pressure.
Recent exchange netflow data for ETH has leaned toward outflows, suggesting that investors are withdrawing coins into self-custody, a behavior often associated with long-term confidence rather than immediate selling.
At the same time, institutional demand for Ethereum continues to strengthen, bolstered by ongoing discussions about staking integration within regulated financial products such as ETFs.
Featured image created with DALL-E, Chart from TradingView
Why this matters
This ethereum story adds another data point to the current market tape and is useful when read alongside nearby source coverage.
Original source
Read on NewsBTCRelated market context

XRP Price Today: $0.98 Support Under Threat Despite Oversold RSI
Deeply oversold indicators suggest a possible relief bounce, but the broader technical structure remains bearish. The XRP price ha...

Bitcoin Breaks Below $70,000 as Liquidations Sweep Through Leveraged Longs
Bitcoin (BTC) fell below $70,000 late Thursday in the U.S. and kept sliding past midnight, touching $67,555 on Coinbase as forced...

Ethereum Dancing on Two Fronts as Quantum Upgrade Advances and Treasury Leverage Bites
Ethereum developers want to upgrade the network to be quantum-ready by 2027, potentially accelerating one of its biggest security...
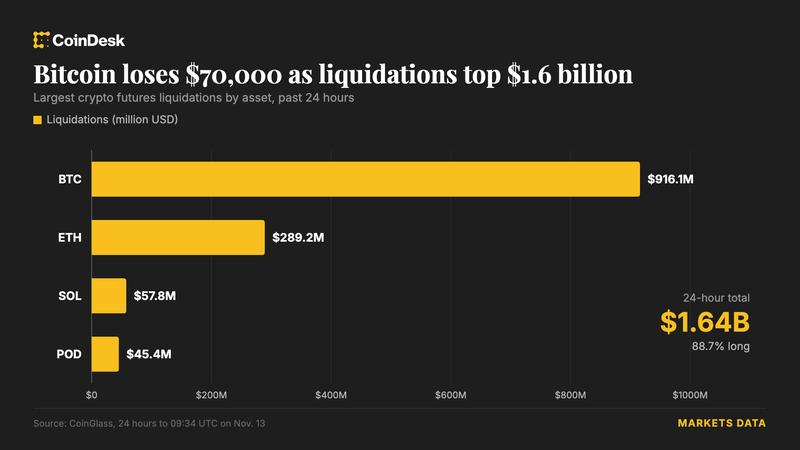
Bitcoin hits 12-week low as dollar rallies on interest-rate outlook, liquidations top $1.6 billion
Bitcoin (BTC) fell below $70,000 for the first time since August and is down 3.5% since midnight UTC, as the dollar climbs and liq...

Bitcoin Price Falls 14% in a Week to $65,000 as Weekend Selling Breaks Friday’s Low
Bitcoin Magazine Bitcoin Price Falls 14% in a Week to $65,000 as Weekend Selling Breaks Friday’s Low Bitcoin price crashed about 1...

U.S. Wholesale Inflation Hits 6.5%—What It Means for Bitcoin’s Next Move
Bitcoin’s inflation problem has a fresh complication. U.S. wholesale prices rose 6.5% over the year to October, their fastest annu...