Ethereum onchain data suggests $2K ETH price is out of reach for now
Ether’s (ETH) price has been consolidating within a roughly $130 range over the last seven days as $2,000 remains strong overhead resistance.Data from Cointelegraph Markets Pro and Bitstamp shows that ETH price oscillate...
Archive context
Older archive item. Useful for background and entity history, but not a fresh market-moving signal.

Ether’s (ETH) price has been consolidating within a roughly $130 range over the last seven days as $2,000 remains strong overhead resistance.
Data from Cointelegraph Markets Pro and Bitstamp shows that ETH price oscillates within a tight range between $1,810 and $1,960.
ETH/USD daily chart. Source: Cointelegraph/TradingView
Ether price remains pinned below $2,000 for several reasons, including declining Ethereum’s weak network activity and decreasing TVL, negative spot Ethereum ETF flows, and weak technicals.
Negative spot Ethereum ETF outflowsThe underperformance in Ether’s price can be attributed to investors’ risk-off behavior, which is visible across the spot Ethereum exchange-traded funds (ETFs). ETH outflows from these investment products have persisted for more than two weeks.
US-based spot Ether ETFs have recorded a streak of outflows for the last seven days, totaling $265.4 million, as per data from SoSoValue.
Ether ETF flow chart. Source: SoSoValue
At the same time, other Ethereum investment products saw outflows totaling $176 million. This brings month-to-date outflows out of Ether ETPs to $265 million, in what CoinShares’s head of research, James Butterfill, described as the “worst on record.”
He noted:
“This also marks the 17th straight day of outflows, the longest negative streak since our records began in 2015.”Weak onchain activity hurts ETH priceTo understand the key drivers behind Ether’s weakness, it is essential to analyze Ethereum’s onchain metrics.
The Ethereum network maintained its leadership based on the 7-day decentralized exchange (DEX) volume. However, the metric has been declining over the last few weeks, dropping by approximately 30% in the last seven days to reach $16.8 billion on March 17.
Ethereum: 7-day DEX volumes, USD. Source: DefiLlama
Key weaknesses for Ethereum included an 85% drop in activity on Maverick Protocol and a 45% decline in Dodo’s volumes.
Similarly, Ethereum’s total value locked (TVL) decreased 9.3% month-to-date, down 47% from its January high of $77 billion to $46.37 billion on March 11.
Ethereum: total value locked. Source: DefiLlama
Lido was among the weakest performers in Ethereum deposits, with TVL dropping 30% over 30 days. Other notable declines included EigenLayer (-30%), Ether.fi (-29%), and Maker (-28%).
Ether’s bear flag target is at $1,530Meanwhile, Ether’s technicals show a potential bear flag on the four-hour chart, which hints at more downside in the coming days or weeks.
Related: ETH may bottom at $1.6K, SEC delays multiple crypto ETFs, and more: Hodler’s Digest, March 9 – 15
A bear flag is a downward continuation pattern characterized by a small, upward-sloping channel formed by parallel lines against the prevailing downtrend. It gets resolved when the price decisively breaks below its lower trendline and falls by as much as the prevailing downtrend’s height.
ETH bulls are counting on support from the flag’s lower boundary at $1,880. A daily candlestick close below this level would signal a bearish breakout from the chart formation, projecting a decline to $1,530. Such a move would represent a 20% descent from the current price.
ETH/USD daily chart. Source: Cointelegraph/TradingView
The relative strength index is positioned in the negative region at 48, suggesting that the market conditions still favor the downside.
The bulls will attempt a daily candlestick close above the flag’s middle boundary at $1,930 (embraced by the 50 SMA) to defend the support at $1,880. They must push the price above the flag’s upper limit of $1,970 to invalidate the bear flag chart pattern.
This article does not contain investment advice or recommendations. Every investment and trading move involves risk, and readers should conduct their own research when making a decision.
Why this matters
This ethereum story adds another data point to the current market tape and is useful when read alongside nearby source coverage.
Original source
Read on CointelegraphRelated market context

ETH USD Loses Ground as Ethereum Price Analysis Remains Targeting $3,000 This Week
Ethereum Price Prediction, September 23: Ethereum (ETH) trades at $2,735, down a marginal 0.61% over the past 24 hours, a pause, n...

Ethereum ETFs Pull In $270M As BlackRock Leads September 21 Rebound
TL;DR US spot Ethereum ETFs recorded $270.0 million of net inflows for the September 21 session. BlackRock’s ETHA led the day with...

BlackRock ETF clients purchase $51M in Ethereum
Institutional adoption of Ethereum ETFs highlights a shift towards regulated crypto investments, potentially reshaping traditional...
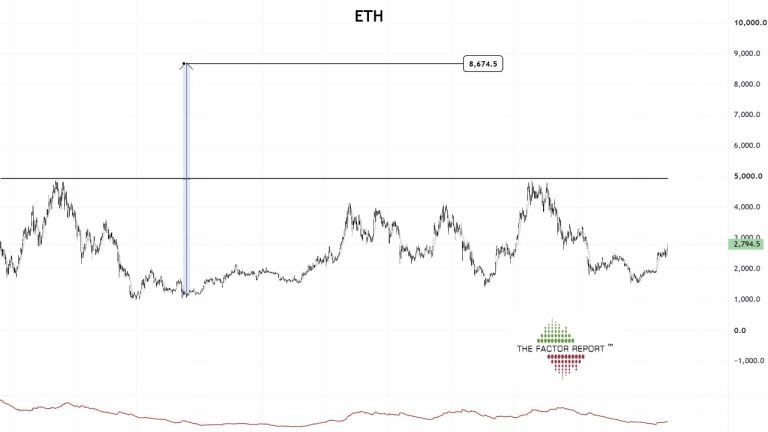
Peter Brandt Sees Ethereum at $8,600 if ETH Clears $5,000
Ethereum could eventually reach $8,600 if it first clears $5,000, according to a long-term chart posted by veteran trader Peter Br...

Bitcoin and Ethereum ETFs pull in $877M in a single day as institutional appetite surges
The surge in institutional investments in crypto ETFs signals growing mainstream acceptance and could drive further market stabili...

Cloudflare’s Will Papper suggests Ethereum’s sharding design could enable scalable stablecoin payments
Cloudflare's adoption of Ethereum's sharding design for scalable stablecoin payments could revolutionize machine-to-machine transa...