Ethereum Price Aims for Key Upside: Can Bulls Push Past $2,400?
Ethereum price is again rising and trading above $2,320. ETH must clear the $2,400 resistance to gain bullish momentum in the near term. Ethereum is attempting a recovery wave above the $2,320 zone. The price is trading...

Ethereum price is again rising and trading above $2,320. ETH must clear the $2,400 resistance to gain bullish momentum in the near term.
- Ethereum is attempting a recovery wave above the $2,320 zone.
- The price is trading above $2,350 and the 100-hourly Simple Moving Average.
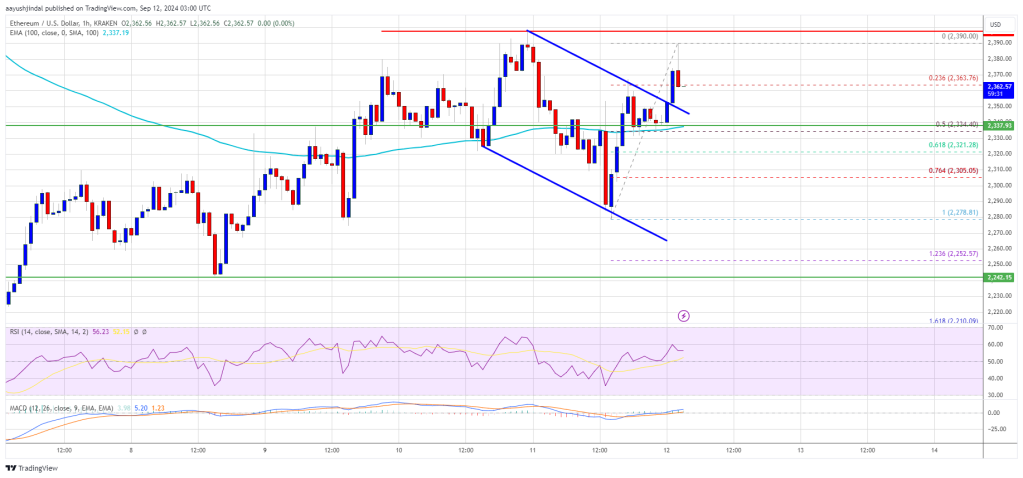
- There was a break above a short-term declining channel with resistance at $2,350 on the hourly chart of ETH/USD (data feed via Kraken).
- The pair must clear the $2,400 resistance to continue higher in the near term.
Ethereum price remained supported above the $2,250 level. A base was formed, and the price started another increase above the $2,300 level like Bitcoin.
There was a break above a short-term declining channel with resistance at $2,350 on the hourly chart of ETH/USD. The pair even surpassed the $2,380 level, but it stayed below the $2,400 resistance level. A high is formed at $2,390 and the price is now consolidating.
It is trading near the 23.6% Fib retracement level of the upward move from the $2,278 swing low to the $2,390 high. Ethereum price is now trading above $2,320 and the 100-hourly Simple Moving Average.
On the upside, the price seems to be facing hurdles near the $2,380 level. The first major resistance is near the $2,400 level. A close above the $2,400 level might send Ether toward the $2,450 resistance. The next key resistance is near $2,500. An upside break above the $2,500 resistance might call for more gains toward the $2,550 resistance zone in the near term.
Another Decline In ETH?If Ethereum fails to clear the $2,380 resistance, it could start another decline in the near term. Initial support on the downside is near $2,350. The first major support sits near the $2,330 zone or the 50% Fib retracement level of the upward move from the $2,278 swing low to the $2,390 high.
A clear move below the $2,330 support might push the price toward $2,250. Any more losses might send the price toward the $2,200 support level in the near term. The next key support sits at $2,120.
Technical Indicators
Hourly MACD – The MACD for ETH/USD is losing momentum in the bullish zone.
Hourly RSI – The RSI for ETH/USD is now above the 50 zone.
Major Support Level – $2,330
Major Resistance Level – $2,400
Original source
Read on NewsBTCRelated market context

Uranium Holds Above $85 as Mining ETF Rebounds From June Sell-Off
The latest charts display that the market is divided into stable physical prices and uranium shares trying to regain momentum afte...

Bitcoin price challenges $64,000 weekend wall – needing a breakout or risk a deeper correction
Bitcoin reclaimed $64,000 on June 12 and touched an intraday high of $64,301 in the same session that spot ETF flows finally flipp...

Standard Chartered Says Bitcoin Bottomed Near $59,000 As Crypto Winter Ends
TL;DR Standard Chartered’s Geoffrey Kendrick reportedly says Bitcoin’s $59,000 area marked the cycle bottom. The note cites SpaceX...

Google Gemini AI Predicts Jaw-Dropping XRP Price For Next 90 Days
Google Gemini AI just put XRP back under the spotlight, predicting it is tightly wound for a major breakout toward $1.60 to $1.80...

North Korea declares denuclearization irreversibly terminated, raising stakes for crypto security
North Korea's stance heightens geopolitical tensions and underscores the urgent need for enhanced cybersecurity measures in the cr...

Bitcoin rises above $64,000 after Pakistan prime minister says Iran peace deal is near
Bitcoin traded above $64,000 on Saturday, supported by its strongest ETF inflows in a month and growing optimism around geopolitic...