Ethereum Price Another Rejection Signals Risk of Bearish Reaction
Ethereum struggled once again to clear the $1,640 resistance against the US Dollar. ETH is correcting lower and remains at a risk of a move below the $1,550 support. Ethereum is slowly moving lower below the $1,620 and $...

Ethereum struggled once again to clear the $1,640 resistance against the US Dollar. ETH is correcting lower and remains at a risk of a move below the $1,550 support.
- Ethereum is slowly moving lower below the $1,620 and $1,600 levels.
- The price is now trading below $1,600 and the 100 hourly simple moving average.
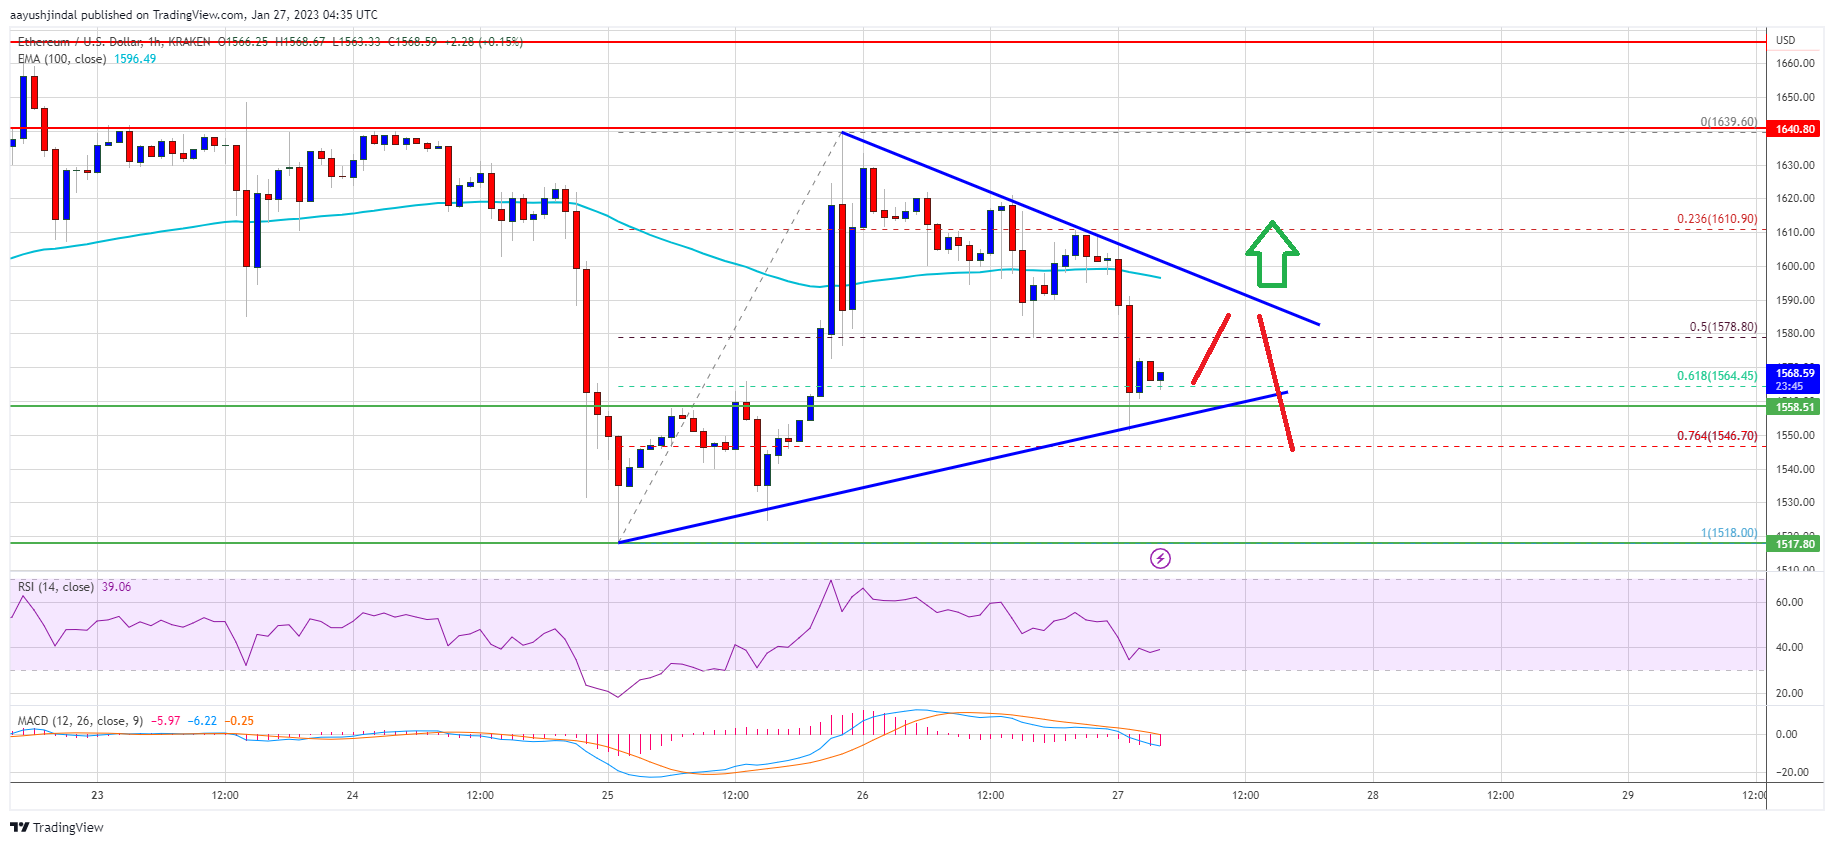
- There is a key contracting triangle forming with resistance near $1,590 on the hourly chart of ETH/USD (data feed via Kraken).
- The pair could start another decline if there is a clear move below the $1,550 support.
Ethereum price started a decent increase above the $1,600 pivot level. ETH attempted a fresh upside break above the $1,640 resistance zone, but the bears protected more upsides.
A high was formed near $1,639 and the price started a downside correction. There was a move below the $1,600 level and the 100 hourly simple moving average. The price declined below the 50% Fib retracement level of the recent leg from the $1,518 swing low to $1,639 high.
However, the bulls were active near the $1,550 support zone. The price stayed above the 61.8% Fib retracement level of the recent leg from the $1,518 swing low to $1,639 high.
Ether price is now trading below $1,600 and the 100 hourly simple moving average. An immediate resistance is near the $1,590 level. There is also a key contracting triangle forming with resistance near $1,590 on the hourly chart of ETH/USD.
Source: ETHUSD on TradingView.com
The next major resistance is near the $1,640 level. An upside break above the $1,640 resistance zone could start a decent increase. In the stated case, the price may perhaps rise towards the $1,720 resistance.
More Losses in ETH?If ethereum fails to clear the $1,600 resistance, it could continue to move down. An initial support on the downside is near the $1,550 level or the triangle lower trend line.
The next major support is near the $1,520 level. If there is a break below $1,520, the price might drop towards the $1,450 support. Any more losses might call for a retest of the $1,365 zone in the near term.
Technical Indicators
Hourly MACD – The MACD for ETH/USD is now gaining momentum in the bearish zone.
Hourly RSI – The RSI for ETH/USD is now below the 50 level.
Major Support Level – $1,550
Major Resistance Level – $1,600
Original source
Read on NewsBTCRelated market context

Uranium Holds Above $85 as Mining ETF Rebounds From June Sell-Off
The latest charts display that the market is divided into stable physical prices and uranium shares trying to regain momentum afte...

Tether USDT Briefly Overtakes Ethereum in Market Cap: A $187B Wake-Up Call
For a few hours, earlier this week, Tether USDT stablecoin held a higher market cap than Ethereum, the first time that has happene...

Wall Street is moving past crypto pilots and deeper into Ethereum, says Etherealize founder
In an interview with CoinDesk, Etherealize cofounder Vivek Raman said Ethereum is currently in a transitional phase where the infr...

Standard Chartered Says Bitcoin Bottomed Near $59,000 As Crypto Winter Ends
TL;DR Standard Chartered’s Geoffrey Kendrick reportedly says Bitcoin’s $59,000 area marked the cycle bottom. The note cites SpaceX...

Elon Musk’s trillionaire status puts his net worth above crypto’s entire market cap outside Bitcoin
Elon Musk has become the first person in modern history to amass a personal net worth exceeding $1 trillion, crossing the historic...

Crypto Today: Bitcoin ETF Rumours, Ethereum Strength, and Mining Heat for Canadian Homes
Bitcoin ETF rumours lift sentiment, Ethereum recaptures $3,800, and North Vancouver uses mining heat for homes. Coinbase unveils p...