Ethereum Price Approaches Key $3K Test, Recovery Momentum at Inflection Point
Ethereum price started a recovery wave above $2,850. ETH faces resistance near $3,000 and might start a fresh decline in the near term. Ethereum started a recovery wave above $2,800 and $2,850. The price is trading above...

Ethereum price started a recovery wave above $2,850. ETH faces resistance near $3,000 and might start a fresh decline in the near term.
- Ethereum started a recovery wave above $2,800 and $2,850.
- The price is trading above $2,850 and the 100-hourly Simple Moving Average.
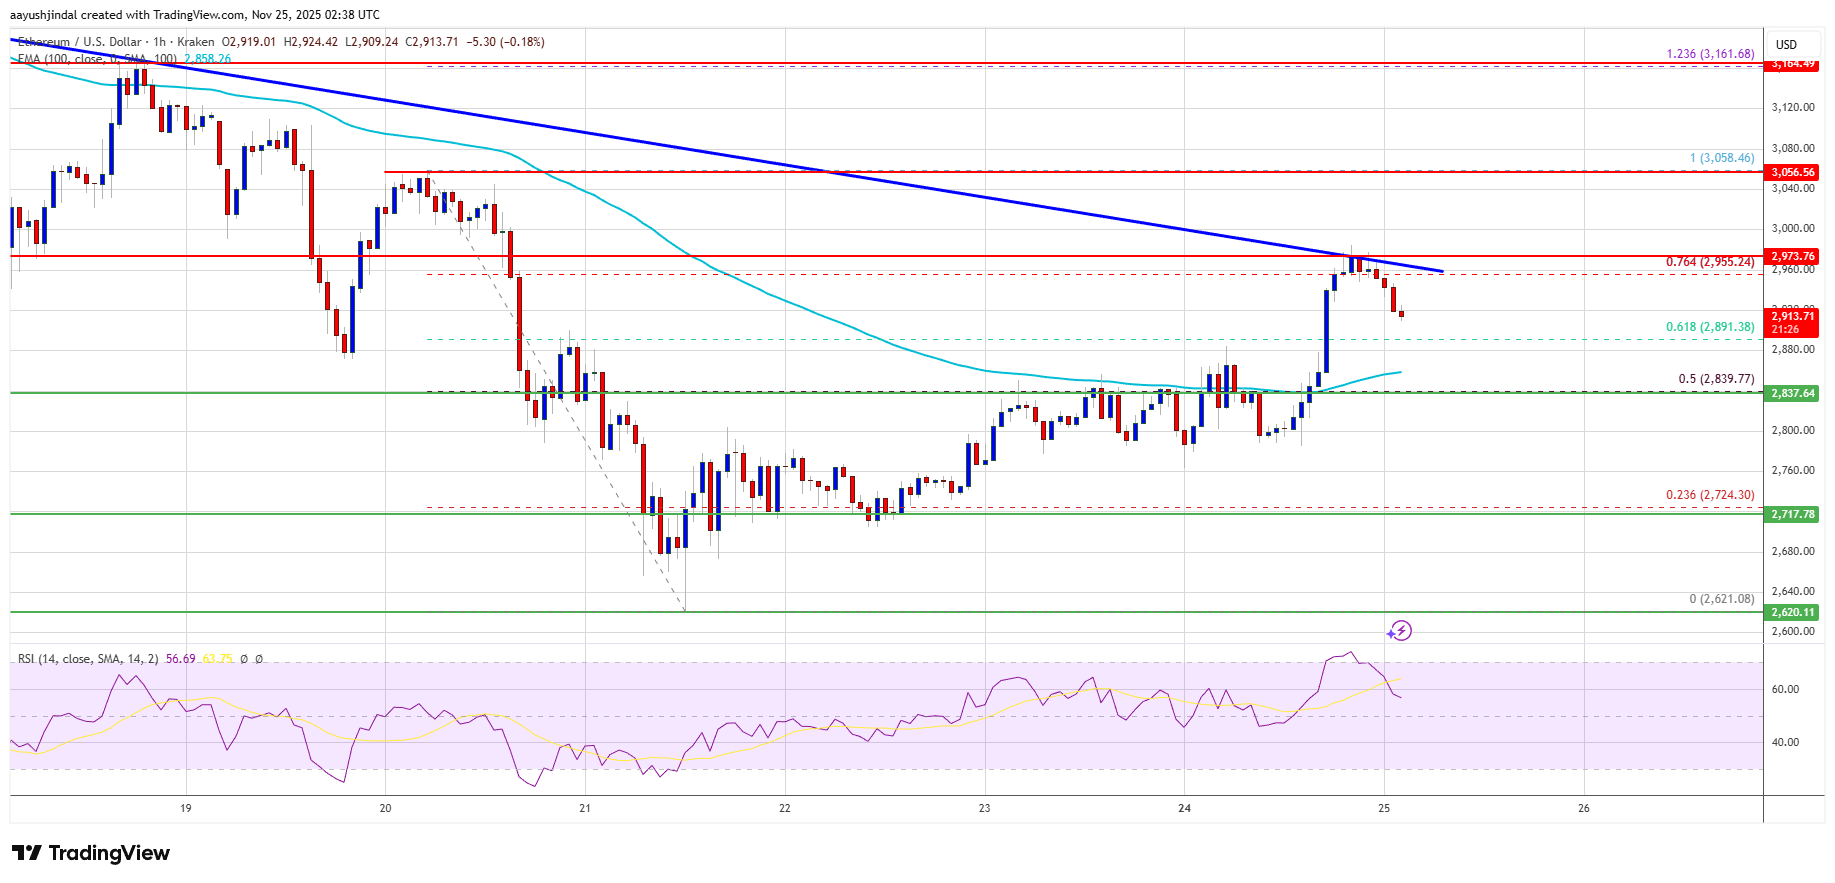
- There is a key bearish trend line forming with resistance at $2,970 on the hourly chart of ETH/USD (data feed via Kraken).
- The pair could continue to move down if it settles below the $2,840 zone.
Ethereum price managed to stay above $2,650 and started a recovery wave, like Bitcoin. ETH price was able to climb above the $2,740 and $2,800 levels.
The bulls were able to push the price above the 50% Fib retracement level of the downward move from the $3,058 swing high to the $2,620 low. However, the bears seem to be active below the $3,000 resistance zone. There is also a key bearish trend line forming with resistance at $2,970 on the hourly chart of ETH/USD.
Ethereum price is now trading above $2,840 and the 100-hourly Simple Moving Average. If there is another recovery wave, the price could face resistance near the $2,950 level and the 76.4% Fib retracement level of the downward move from the $3,058 swing high to the $2,620 low.
The next key resistance is near the $2,970 level. The first major resistance is near the $3,000 level. A clear move above the $3,000 resistance might send the price toward the $3,050 resistance. An upside break above the $3,050 region might call for more gains in the coming days. In the stated case, Ether could rise toward the $3,120 resistance zone or even $3,250 in the near term.
Another Drop In ETH?If Ethereum fails to clear the $2,950 resistance, it could start a fresh decline. Initial support on the downside is near the $2,840 level. The first major support sits near the $2,780 zone.
A clear move below the $2,780 support might push the price toward the $2,740 support. Any more losses might send the price toward the $2,650 region in the near term. The next key support sits at $2,550 and $2,500.
Technical Indicators
Hourly MACD – The MACD for ETH/USD is losing momentum in the bullish zone.
Hourly RSI – The RSI for ETH/USD is now above the 50 zone.
Major Support Level – $2,800
Major Resistance Level – $2,950
Original source
Read on NewsBTCRelated market context

Bitcoin (BTC) Price Prediction: BTC Eyes $70K Liquidity Sweep as Whales Reclaim Control Near $62K
Market data suggests that long-term holders remain largely inactive, while whale activity is beginning to recover, creating an int...

Ethereum Price Prediction: 3 Million ETH Rushes Into Staking as Sellers Vanish
Is nobody leaving Ethereum? A record 36 million ETH is now locked in staking, roughly 29–30% of the circulating supply, and the va...

Ethereum Nears 200 Million Non-Empty Wallets Despite Market Uncertainty
Despite persistent market uncertainty and bearish sentiment across parts of the cryptocurrency sector, Ethereum is approaching a s...

Most Traders Will Scroll Past This Grok AI Bitcoin Predicts, Big Mistake
Elon Musk Grok AI just looked at a Bitcoin chart down more than 50% and predicts it’s a classic accumulation zone, targeting $150,...

XRP Price Prediction: Japan XRP ETF Listing is Getting Closer
Japan just handed XRP bulls a major regulatory tailwind. XRP price is retesting a congestion zone, and the prediction could turn b...

The 3-Part Impulse That Shows Where The XRP Price Is Headed Next
XRP bulls are trying to turn a brutal selloff into something bigger than a relief bounce. An interesting setup shows a possible th...