Ethereum Price Approaches Resistance—Will It Smash Through?
Ethereum price started a recovery wave above the $1,850 level. ETH is now consolidating and facing key hurdles near the $1,920 level. Ethereum started a recovery wave above $1,820 and $1,850 levels. The price is trading...
Archive context
Older archive item. Useful for background and entity history, but not a fresh market-moving signal.

Ethereum price started a recovery wave above the $1,850 level. ETH is now consolidating and facing key hurdles near the $1,920 level.
- Ethereum started a recovery wave above $1,820 and $1,850 levels.
- The price is trading above $1,860 and the 100-hourly Simple Moving Average.
- There is a connecting bullish trend line forming with support at $1,860 on the hourly chart of ETH/USD (data feed via Kraken).
- The pair must clear the $1,900 and $1,920 resistance levels to start a decent increase.
Ethereum price managed to stay above the $1,750 support zone and started a recovery wave, like Bitcoin. ETH was able to climb above the $1,820 and $1,850 resistance levels.
The bulls even pushed the price above the $1,880 resistance zone. There was a move above the 50% Fib retracement level of the downward wave from the $2,032 swing high to the $1,767 low. However, the bears are active near the $1,920 zone.
Ethereum price is now trading above $1,850 and the 100-hourly Simple Moving Average. There is also a connecting bullish trend line forming with support at $1,860 on the hourly chart of ETH/USD.
On the upside, the price seems to be facing hurdles near the $1,900 level. The next key resistance is near the $1,920 level and the 61.8% Fib retracement level of the downward wave from the $2,032 swing high to the $1,767 low.

The first major resistance is near the $1,970 level. A clear move above the $1,970 resistance might send the price toward the $2,020 resistance. An upside break above the $2,020 resistance might call for more gains in the coming sessions. In the stated case, Ether could rise toward the $2,050 resistance zone or even $2,120 in the near term.
Another Decline In ETH?If Ethereum fails to clear the $1,920 resistance, it could start another decline. Initial support on the downside is near the $1,860 level and the trend line. The first major support sits near the $1,845 zone.
A clear move below the $1,845 support might push the price toward the $1,800 support. Any more losses might send the price toward the $1,765 support level in the near term. The next key support sits at $1,710.
Technical Indicators
Hourly MACD – The MACD for ETH/USD is losing momentum in the bullish zone.
Hourly RSI – The RSI for ETH/USD is now above the 50 zone.
Major Support Level – $1,860
Major Resistance Level – $1,920
Why this matters
This ethereum story adds another data point to the current market tape and is useful when read alongside nearby source coverage.
Original source
Read on NewsBTCRelated market context

ETH USD Loses Ground as Ethereum Price Analysis Remains Targeting $3,000 This Week
Ethereum Price Prediction, September 23: Ethereum (ETH) trades at $2,735, down a marginal 0.61% over the past 24 hours, a pause, n...

Nearly $20 million in XRP drained from 6,678 wallets across six attack waves
Nearly $20 million of XRP was drained from thousands of hardware wallets in six waves spanning nearly a week. Blockchain analysis...

Solana Price Prediction: Golden Cross and $2.97B Open Interest Put $400 Target in Focus
Solana price is trading near $117.38 after recovering strongly from its recent lows. With SOL now testing the crucial $118–$120 re...

Solana moves Alpenglow into testnet as SOL nears January highs
Solana has begun rolling out Alpenglow on testnet, moving its planned blockchain consensus overhaul into a public testing environm...
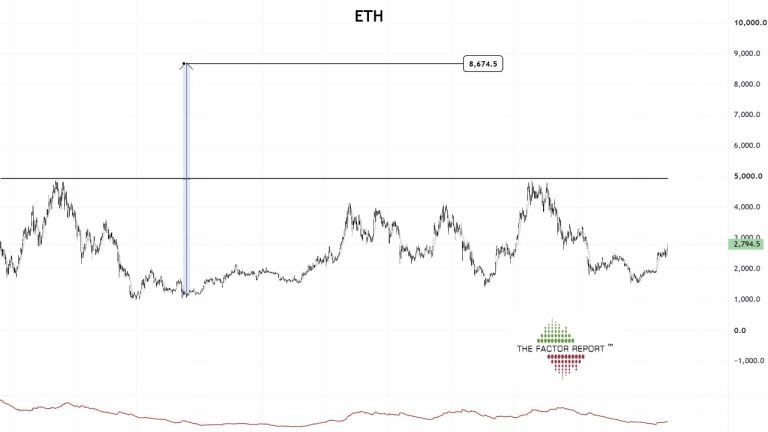
Peter Brandt Sees Ethereum at $8,600 if ETH Clears $5,000
Ethereum could eventually reach $8,600 if it first clears $5,000, according to a long-term chart posted by veteran trader Peter Br...

XRP Price Today: XRP Hits $1.60 as Heavy Whale Accumulation Points to a $2 Rally and Beyond
The XRP price reached $1.6060 on September 23 after opening near $1.5808, according to historical market data. The token subsequen...