Ethereum Price Avoids Collapse But Recovery Could Be Capped
Ethereum price managed to recover from the $1,520 level against the US dollar. ETH is now facing hurdles near the $1,565 and $1,600 resistance levels. Ethereum is attempting a recovery wave above the $1,550 level. The pr...

Ethereum price managed to recover from the $1,520 level against the US dollar. ETH is now facing hurdles near the $1,565 and $1,600 resistance levels.
- Ethereum is attempting a recovery wave above the $1,550 level.
- The price is trading just above $1,550 and the 100-hourly Simple Moving Average.
- There was a break above a major bearish trend line with resistance near $1,555 on the hourly chart of ETH/USD (data feed via Kraken).
- The pair could start another decline unless there is a clear move above $1,565 and $1,600.
Ethereum managed to stay above the $1,500 and $1,520 levels. ETH formed a short-term support base and recently started a fresh increase from the $1,520 zone, like Bitcoin.
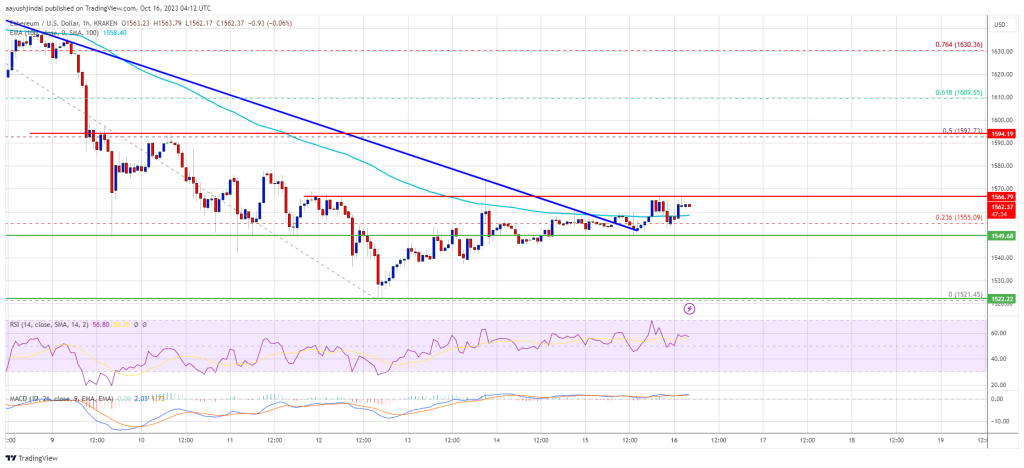
There was a move above the $1,550 resistance level. The price climbed above the 23.6% Fib retracement level of the main drop from the $1,664 swing high to the $1,521 low. Besides, there was a break above a major bearish trend line with resistance near $1,555 on the hourly chart of ETH/USD.
Ethereum is now trading just above $1,550 and the 100-hourly Simple Moving Average. However, the bears seem to be preventing an upside break above the $1,565 resistance.
If there is a clear move above the $1,565 resistance, Ether could rise toward the next major hurdle at $1,600. It is close to the 50% Fib retracement level of the main drop from the $1,664 swing high to the $1,521 low. A close above the $1,600 resistance might start a decent increase.
Source: ETHUSD on TradingView.com
In the stated case, Ether could rise and recover toward the $1,665 resistance. Any more gains might open the doors for a move toward $1,750.
Another Decline in ETH?If Ethereum fails to clear the $1,565 resistance, it could start another decline. Initial support on the downside is near the $1,550 level and the 100-hourly Simple Moving Average.
The next key support is $1,520. A downside break below the $1,520 support might send the price further lower. In the stated case, the price could drop toward the $1,440 level. Any more losses may perhaps send Ether toward the $1,420 level.
Technical Indicators
Hourly MACD – The MACD for ETH/USD is losing momentum in the bullish zone.
Hourly RSI – The RSI for ETH/USD is now above the 50 level.
Major Support Level – $1,550
Major Resistance Level – $1,565
Original source
Read on NewsBTCRelated market context

Tether USDT Briefly Overtakes Ethereum in Market Cap: A $187B Wake-Up Call
For a few hours, earlier this week, Tether USDT stablecoin held a higher market cap than Ethereum, the first time that has happene...

Bitcoin price challenges $64,000 weekend wall – needing a breakout or risk a deeper correction
Bitcoin reclaimed $64,000 on June 12 and touched an intraday high of $64,301 in the same session that spot ETF flows finally flipp...

Uranium Holds Above $85 as Mining ETF Rebounds From June Sell-Off
The latest charts display that the market is divided into stable physical prices and uranium shares trying to regain momentum afte...

Google Gemini AI Predicts Jaw-Dropping XRP Price For Next 90 Days
Google Gemini AI just put XRP back under the spotlight, predicting it is tightly wound for a major breakout toward $1.60 to $1.80...

Standard Chartered Says Bitcoin Bottomed Near $59,000 As Crypto Winter Ends
TL;DR Standard Chartered’s Geoffrey Kendrick reportedly says Bitcoin’s $59,000 area marked the cycle bottom. The note cites SpaceX...

Elon Musk’s trillionaire status puts his net worth above crypto’s entire market cap outside Bitcoin
Elon Musk has become the first person in modern history to amass a personal net worth exceeding $1 trillion, crossing the historic...