Ethereum Price Battles Key Barrier as Bulls Eye a Breakout Attempt
Ethereum price started a recovery wave above the $4,150 zone. ETH is now back above $4,250 but it faces many hurdles near $4,300. Ethereum started a recovery wave above the $4,200 and $4,250 levels. The price is trading...
Archive context
Older archive item. Useful for background and entity history, but not a fresh market-moving signal.

Ethereum price started a recovery wave above the $4,150 zone. ETH is now back above $4,250 but it faces many hurdles near $4,300.
- Ethereum started a recovery wave above the $4,200 and $4,250 levels.
- The price is trading below $4,320 and the 100-hourly Simple Moving Average.
- There is a bearish trend line forming with resistance at $4,300 on the hourly chart of ETH/USD (data feed via Kraken).
- The pair could continue to move down if it settles below the $4,180 zone in the near term.
Ethereum price extended losses after there was a close below the $4,200 level, like Bitcoin. ETH price gained bearish momentum and traded below the $4,110 support zone.
The bears were able to push the price below the $4,080 support zone. Finally, the price tested the $4,065 zone. A low was formed at $4,065 and the price recently started a recovery wave above the 23.6% Fib retracement level of the recent decline from the $4,580 swing high to the $4,065 low.
The price failed to clear the $4,350 zone and the 61.8% Fib retracement level of the recent decline from the $4,580 swing high to the $4,065 low. There is also a bearish trend line forming with resistance at $4,300 on the hourly chart of ETH/USD.
Ethereum price is now trading below $4,300 and the 100-hourly Simple Moving Average. On the upside, the price could face resistance near the $4,300 level. The next key resistance is near the $4,350 level.
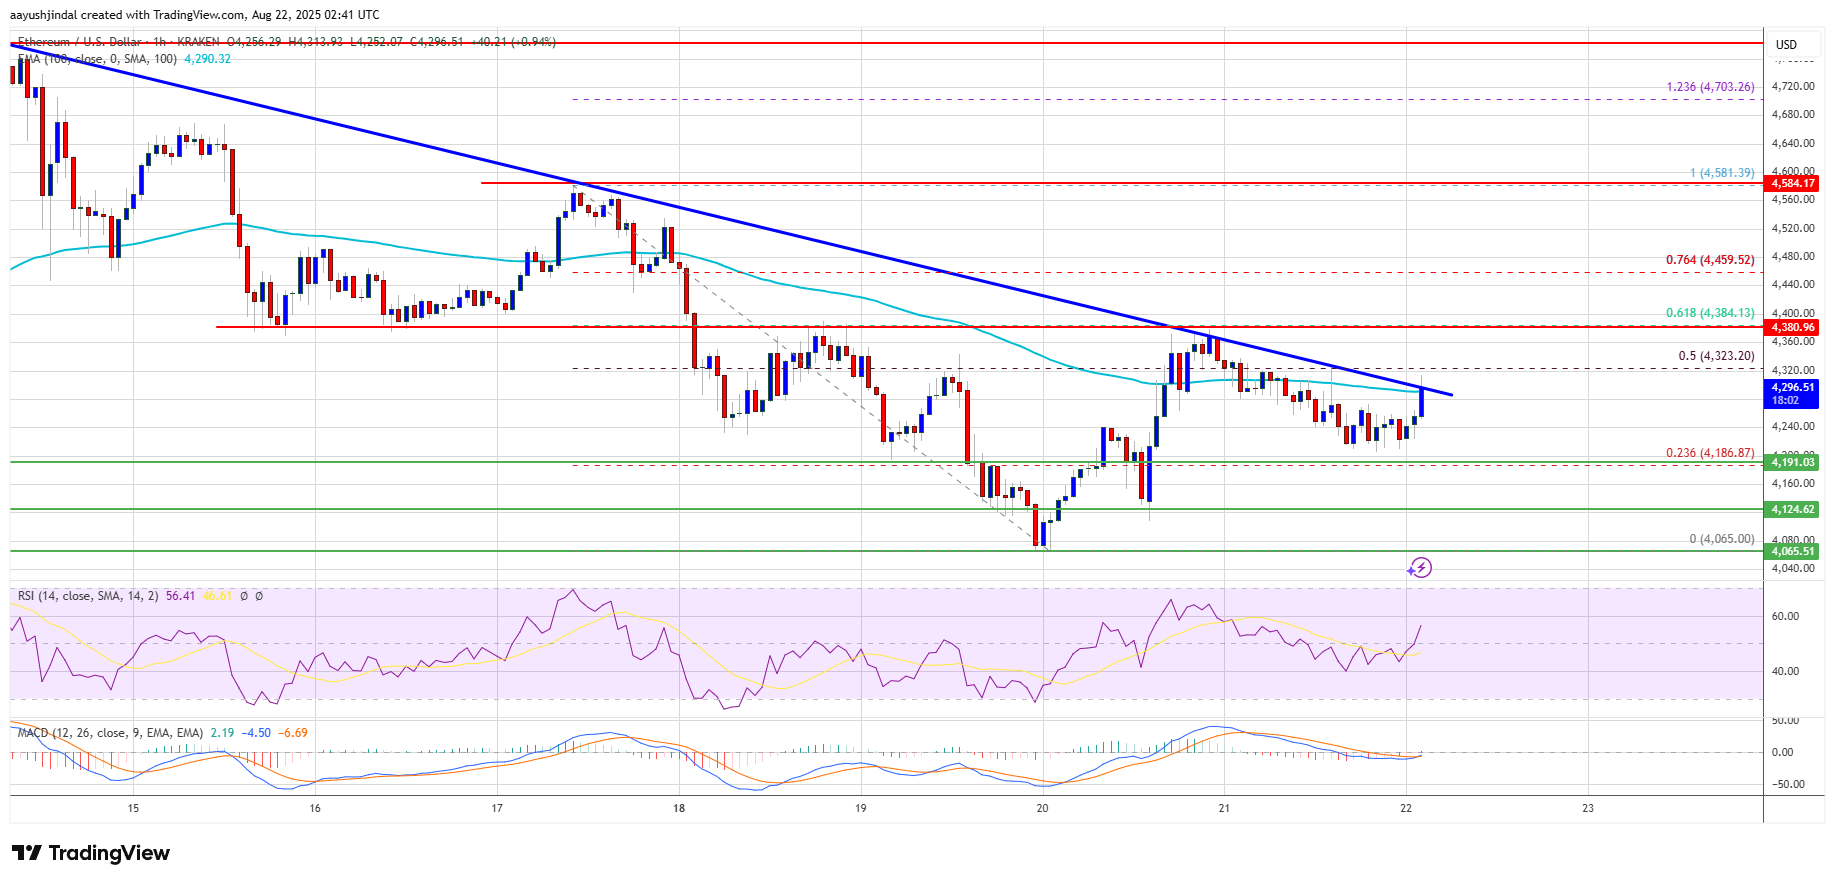
The first major resistance is near the $4,385 level. A clear move above the $4,385 resistance might send the price toward the $4,450 resistance. An upside break above the $4,450 resistance might call for more gains in the coming sessions. In the stated case, Ether could rise toward the $4,500 resistance zone or even $4,550 in the near term.
Another Drop In ETH?If Ethereum fails to clear the $4,300 resistance, it could continue to move down. Initial support on the downside is near the $4,220 level. The first major support sits near the $4,180 zone.
A clear move below the $4,180 support might push the price toward the $4,120 support. Any more losses might send the price toward the $4,065 support level in the near term. The next key support sits at $4,000.
Technical Indicators
Hourly MACD – The MACD for ETH/USD is losing momentum in the bearish zone.
Hourly RSI – The RSI for ETH/USD is now above the 50 zone.
Major Support Level – $4,180
Major Resistance Level – $4,385
Why this matters
This ethereum story adds another data point to the current market tape and is useful when read alongside nearby source coverage.
Original source
Read on NewsBTCRelated market context

ETH USD Loses Ground as Ethereum Price Analysis Remains Targeting $3,000 This Week
Ethereum Price Prediction, September 23: Ethereum (ETH) trades at $2,735, down a marginal 0.61% over the past 24 hours, a pause, n...

Bitcoin clears $86,000 as $1B in shorts liquidated again – battle now shifts to $90k
Bitcoin’s break above $86,000 has cleared a major pocket of bearish leverage and put $90,000 back in traders’ sights. The largest...

Bitcoin Recoils Below $86,000: Is Bitcoin Price Prediction Still Shooting For $90,000?
Bitcoin Price Prediction: Bitcoin (BTC) trades at $85,954, down a modest 0.3% on the day, holding the upper band of a rebound that...

BTC USD Fights For $85K: Bitcoin Price Prediction Says $90K Still in Play
Bitcoin is trading at $85,954, down 0.8% on the day after briefly tagging $86,922 earlier in the session. That pullback from the h...

Can Ripple Crack $1.80? XRP Price Prediction Says This Week
XRP Price Prediction: Ripple (XRP) trades at $1.59 as of this writing, up 1.6% on the day, with a 24-hour range spanning $1.5577 t...

XRP Price Today: XRP Hits $1.60 as Heavy Whale Accumulation Points to a $2 Rally and Beyond
The XRP price reached $1.6060 on September 23 after opening near $1.5808, according to historical market data. The token subsequen...