Ethereum Price Bearish Signal: ETH Below 100 SMA Could Trigger Downside
Ethereum is facing resistance above $1,220 against the US Dollar. ETH could start another decline if it fails to stay above $1,200 and the 100 hourly SMA. Ethereum started an upside correction above the $1,180 resistance...

Ethereum is facing resistance above $1,220 against the US Dollar. ETH could start another decline if it fails to stay above $1,200 and the 100 hourly SMA.
- Ethereum started an upside correction above the $1,180 resistance zone.
- The price is now trading above $1,200 and the 100 hourly simple moving average.
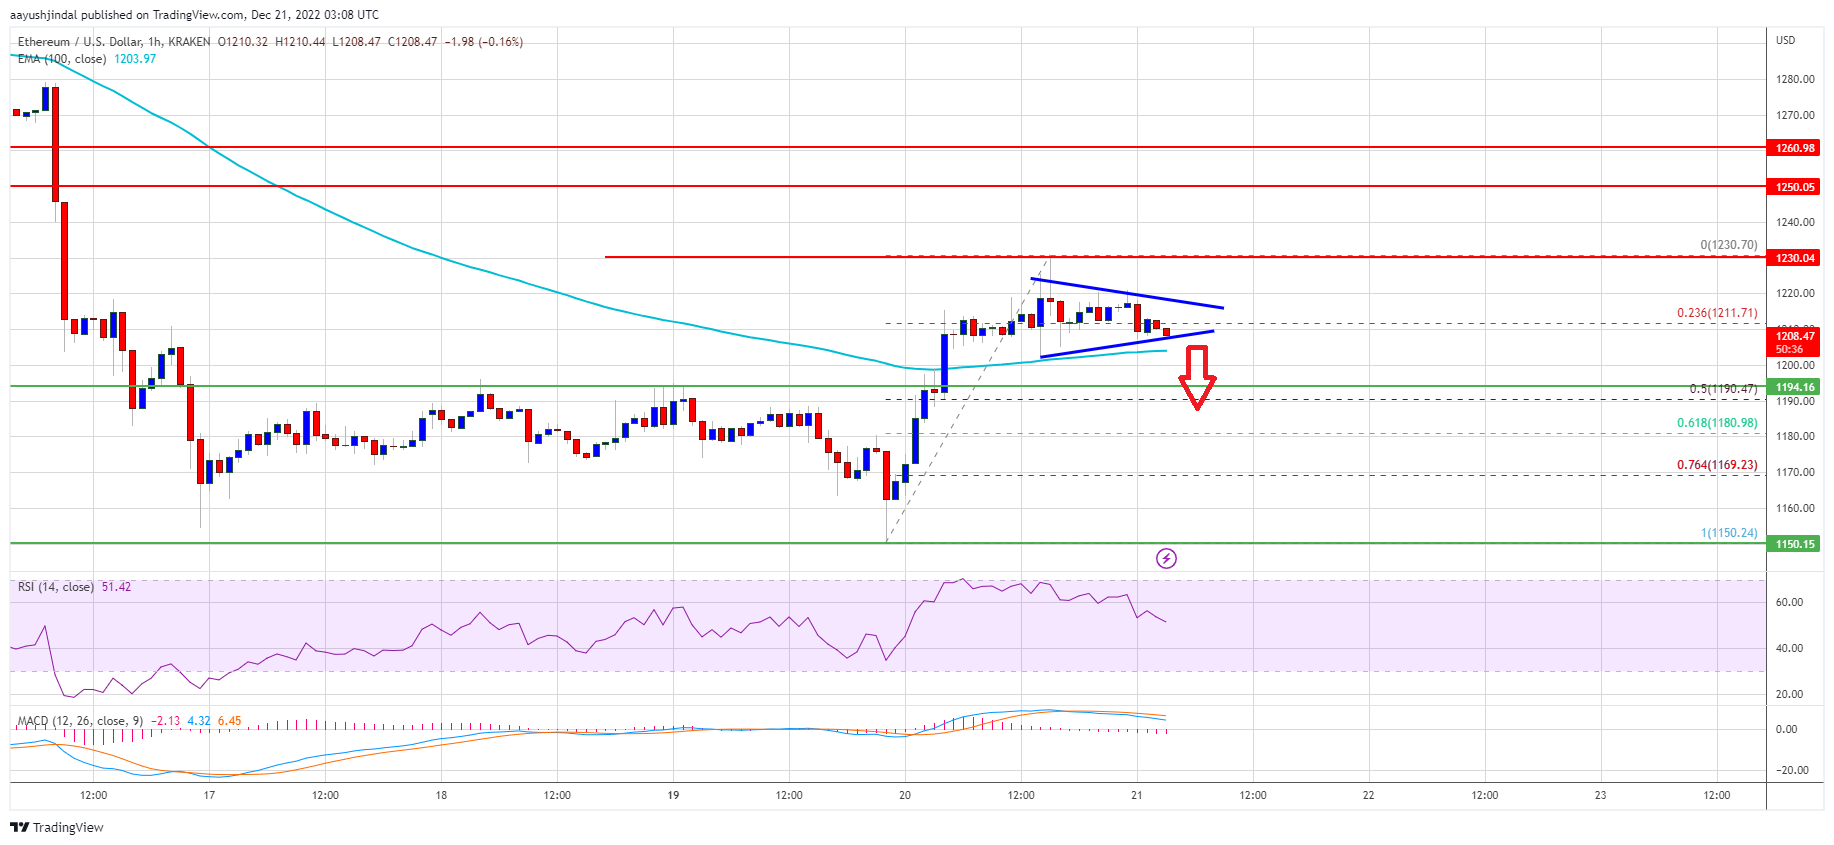
- There is a short-term contracting triangle with resistance near $1,220 on the hourly chart of ETH/USD (data feed via Kraken).
- The pair could start another upward move if there is a wave above the $1,220 resistance.
Ethereum price found support near the $1,150 zone and started a recovery wave. ETH was able to clear the $1,180 and $1,190 levels. The price even climbed above the $1,200 level and the 100 hourly simple moving average, similar to bitcoin.
A high was formed near $1,230 before the price started a consolidation phase. Ether price is now trading near the 23.6% Fib retracement level of the recent increase from the $1,150 swing low to $1,230 high.
The price is now trading above $1,200 and the 100 hourly simple moving average. There is also a short-term contracting triangle with resistance near $1,220 on the hourly chart of ETH/USD. The first major resistance is near the $1,220 level.
Source: ETHUSD on TradingView.com
A clear upside break above the $1,220 resistance and then a move above the $1,230 level could initiate a decent increase. The next major resistance could be $1,260. If the bulls clear the $1,260 resistance, the price might rise towards $1,300. Any more gains might send the price towards the $1,350 resistance zone. An intermediate resistance could be near the $1,320 level.
Fresh Drop in ETH?If ethereum fails to climb above the $1,220 resistance, it could start another bearish wave. An initial support on the downside is near the $1,200 level.
The next major support is near the $1,190 level or the 50% Fib retracement level of the recent increase from the $1,150 swing low to $1,230 high. A clear downside break below $1,190 might push the price lower towards the $1,150 support. Any more losses could lead the price towards the $1,100 support.
Technical Indicators
Hourly MACD – The MACD for ETH/USD is now losing momentum in the bullish zone.
Hourly RSI – The RSI for ETH/USD is now above the 50 level.
Major Support Level – $1,190
Major Resistance Level – $1,220
Original source
Read on NewsBTCRelated market context

Uranium Holds Above $85 as Mining ETF Rebounds From June Sell-Off
The latest charts display that the market is divided into stable physical prices and uranium shares trying to regain momentum afte...

Standard Chartered Says Bitcoin Bottomed Near $59,000 As Crypto Winter Ends
TL;DR Standard Chartered’s Geoffrey Kendrick reportedly says Bitcoin’s $59,000 area marked the cycle bottom. The note cites SpaceX...

Google Gemini AI Predicts Jaw-Dropping XRP Price For Next 90 Days
Google Gemini AI just put XRP back under the spotlight, predicting it is tightly wound for a major breakout toward $1.60 to $1.80...

Bitcoin price challenges $64,000 weekend wall – needing a breakout or risk a deeper correction
Bitcoin reclaimed $64,000 on June 12 and touched an intraday high of $64,301 in the same session that spot ETF flows finally flipp...

Bitcoin rises above $64,000 after Pakistan prime minister says Iran peace deal is near
Bitcoin traded above $64,000 on Saturday, supported by its strongest ETF inflows in a month and growing optimism around geopolitic...

Elon Musk SpaceX AI Predicts Incredible Bitcoin Price For Next 30 Days
Here is the thing about capitulation calls. They only sound smart in hindsight. Right now, with Bitcoin price scraping along the l...