Ethereum Price Bullish Momentum Fades But ETH Bulls Still In Control
Ethereum price is still struggling to clear the $1,920 resistance against the US dollar. ETH is moving lower but downsides might be limited below $1,850. Ethereum is still struggling to clear the $1,920 level. The price...

Ethereum price is still struggling to clear the $1,920 resistance against the US dollar. ETH is moving lower but downsides might be limited below $1,850.
- Ethereum is still struggling to clear the $1,920 level.
- The price is trading above $1,860 and the 100-hourly Simple Moving Average.
- There was a break above a connecting bearish trend line with resistance near $1,880 on the hourly chart of ETH/USD (data feed via Kraken).
- The pair could rise once again unless there is a close below the $1,850 support zone.
Ethereum remained stable above the $1,850 support zone. ETH made another attempt to gain bullish momentum above the $1,880 resistance, like Bitcoin.
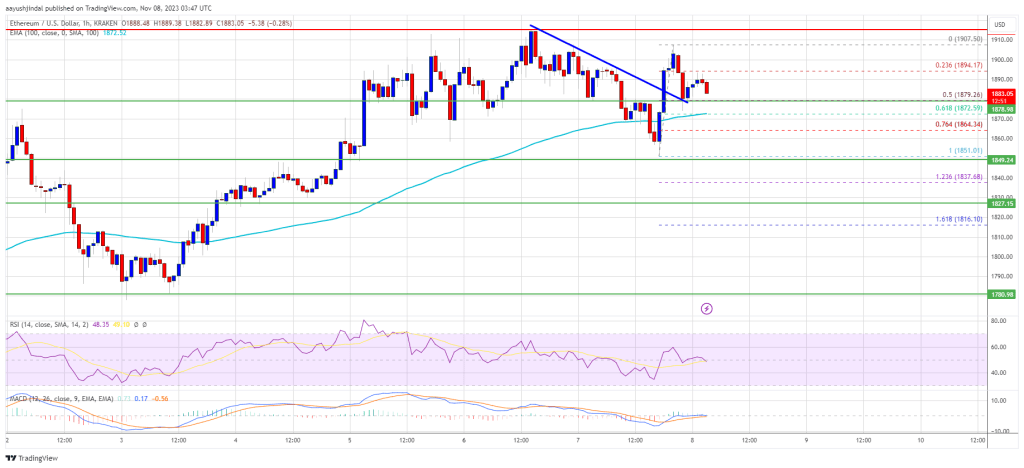
There was a break above a connecting bearish trend line with resistance near $1,880 on the hourly chart of ETH/USD. However, the pair again failed to clear the $1,920 resistance zone. A high is formed near $1,907 and the price is moving lower.
There was a drop below the $1,885 level. The price even tested the 50% Fib retracement level of the recent increase from the $1,851 swing low to the $1,907 high.
Ethereum is now trading above $1,860 and the 100-hourly Simple Moving Average. On the upside, the price is facing resistance near the $1,900 level. The first major resistance sits at $1,920. To start a fresh increase, the bulls need to clear the $1,920 resistance.
Source: ETHUSD on TradingView.com
In the stated case, the price could rally toward the $2,000 resistance. The next key resistance is near $2,050, above which the price could accelerate higher toward the $2,120 level.
Are Dips Limited in ETH?If Ethereum fails to clear the $1,900 resistance, it could continue to move down. Initial support on the downside is near the $1,880 level. The next key support is $1,870 or the 100 hourly SMA.
The 61.8% Fib retracement level of the recent increase from the $1,851 swing low to the $1,907 high is also at $1,870. The main support sits at $1,850. A downside break below the $1,850 support might send Ether further lower. In the stated case, the price could drop toward the $1,780 level.
Technical Indicators
Hourly MACD – The MACD for ETH/USD is losing momentum in the bullish zone.
Hourly RSI – The RSI for ETH/USD is now above the 50 level.
Major Support Level – $1,870
Major Resistance Level – $1,920
Original source
Read on NewsBTCRelated market context

Wall Street is moving past crypto pilots and deeper into Ethereum, says Etherealize founder
In an interview with CoinDesk, Etherealize cofounder Vivek Raman said Ethereum is currently in a transitional phase where the infr...

Uranium Holds Above $85 as Mining ETF Rebounds From June Sell-Off
The latest charts display that the market is divided into stable physical prices and uranium shares trying to regain momentum afte...

Tether USDT Briefly Overtakes Ethereum in Market Cap: A $187B Wake-Up Call
For a few hours, earlier this week, Tether USDT stablecoin held a higher market cap than Ethereum, the first time that has happene...

Standard Chartered Says Bitcoin Bottomed Near $59,000 As Crypto Winter Ends
TL;DR Standard Chartered’s Geoffrey Kendrick reportedly says Bitcoin’s $59,000 area marked the cycle bottom. The note cites SpaceX...

Blackrock’s IBIT Leads $86 Million Bitcoin ETF Inflow as Ethereum Funds Extend Outflow Streak
Spot bitcoin exchange-traded funds (ETFs) drew $85.85 million in net inflows on Friday, with every one of the 12 tracked funds avo...

Elon Musk’s trillionaire status puts his net worth above crypto’s entire market cap outside Bitcoin
Elon Musk has become the first person in modern history to amass a personal net worth exceeding $1 trillion, crossing the historic...