Ethereum Price Bullish Momentum Reignites – Can Bulls Pust ETH To $2,200?
Ethereum price remained strong and started a fresh increase above $2,000. ETH could continue to rise if it clears the $2,075 resistance zone. Ethereum is again moving higher above the $2,000 support zone. The price is tr...

Ethereum price remained strong and started a fresh increase above $2,000. ETH could continue to rise if it clears the $2,075 resistance zone.
- Ethereum is again moving higher above the $2,000 support zone.
- The price is trading above $2,000 and the 100-hourly Simple Moving Average.
- There is a key bullish trend line forming with support near $2,046 on the hourly chart of ETH/USD (data feed via Kraken).
- The pair could accelerate higher if it clears the $2,075 resistance zone in the near term.
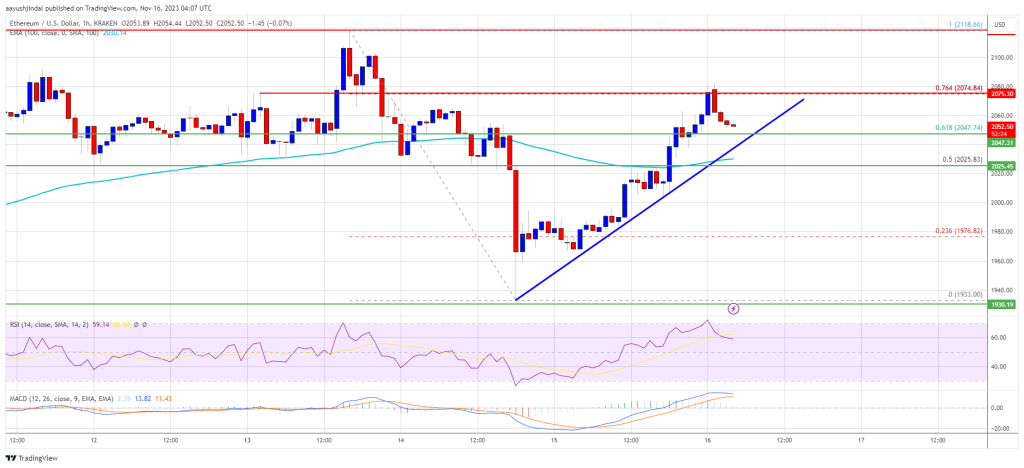
After a downside correction, Ethereum price found support near the $1,920 zone. ETH traded as low as $1,933 and recently started a fresh increase like Bitcoin. There was a clear move above the $1,950 and $1,975 resistance levels.
There was a close above the 50% Fib retracement level of the downward move from the $2,118 swing high to the $1,933 low. Finally, it settled above the main $2,000 resistance zone.
Ethereum is now trading above $2,000 and the 100-hourly Simple Moving Average. There is also a key bullish trend line forming with support near $2,046 on the hourly chart of ETH/USD. Immediate resistance is near the $2,075 zone. It is close to the 76.4% Fib retracement level of the downward move from the $2,118 swing high to the $1,933 low.
Source: ETHUSD on TradingView.com
The next major resistance sits at $2,120. A close above the $2,120 resistance could start another strong increase. The first resistance is near $2,150, above which the price could aim for a move toward the $2,200 level. Any more gains could start a wave toward the $2,250 level.
More Losses in ETH?If Ethereum fails to clear the $2,075 resistance or the $2,120 pivot level, it could start a fresh decline. Initial support on the downside is near the $2,045 level or the trend line.
The next key support is $2,025 or the 100-hourly Simple Moving Average. The main support is $2,000. A downside break below the $2,000 support might start a steady decline. In the stated case, Ether could drop toward the $1,920 support zone in the near term. Any more losses might call for a drop toward the $1,850 level.
Technical Indicators
Hourly MACD – The MACD for ETH/USD is losing momentum in the bullish zone.
Hourly RSI – The RSI for ETH/USD is now above the 50 level.
Major Support Level – $2,025
Major Resistance Level – $2,120
Original source
Read on NewsBTCRelated market context

Tether USDT Briefly Overtakes Ethereum in Market Cap: A $187B Wake-Up Call
For a few hours, earlier this week, Tether USDT stablecoin held a higher market cap than Ethereum, the first time that has happene...

Standard Chartered Says Bitcoin Bottomed Near $59,000 As Crypto Winter Ends
TL;DR Standard Chartered’s Geoffrey Kendrick reportedly says Bitcoin’s $59,000 area marked the cycle bottom. The note cites SpaceX...

Wall Street is moving past crypto pilots and deeper into Ethereum, says Etherealize founder
In an interview with CoinDesk, Etherealize cofounder Vivek Raman said Ethereum is currently in a transitional phase where the infr...

Uranium Holds Above $85 as Mining ETF Rebounds From June Sell-Off
The latest charts display that the market is divided into stable physical prices and uranium shares trying to regain momentum afte...

Google Gemini AI Predicts Jaw-Dropping XRP Price For Next 90 Days
Google Gemini AI just put XRP back under the spotlight, predicting it is tightly wound for a major breakout toward $1.60 to $1.80...

Crypto Today: Bitcoin ETF Rumours, Ethereum Strength, and Mining Heat for Canadian Homes
Bitcoin ETF rumours lift sentiment, Ethereum recaptures $3,800, and North Vancouver uses mining heat for homes. Coinbase unveils p...