Ethereum Price Climbs Above $1,300, Is This A Clear Bullish Signal
Ethereum climbed higher and surpassed the $1,300 resistance zone against the US Dollar. ETH is consolidating gains and might aim more upsides towards the $1,400 resistance. Ethereum was able to gain pace for a move above...

Ethereum climbed higher and surpassed the $1,300 resistance zone against the US Dollar. ETH is consolidating gains and might aim more upsides towards the $1,400 resistance.
- Ethereum was able to gain pace for a move above the $1,275 and $1,280 resistance levels.
- The price is now trading above $1,280 and the 100 hourly simple moving average.
- There is a key bullish trend line forming with support near $1,270 on the hourly chart of ETH/USD (data feed via Kraken).
- The pair could rise further if it stays above the $1,270 support zone.
Ethereum price started a decent increase above the $1,250 level. ETH gained pace and was able to clear the $1,275 resistance zone, similar to bitcoin.
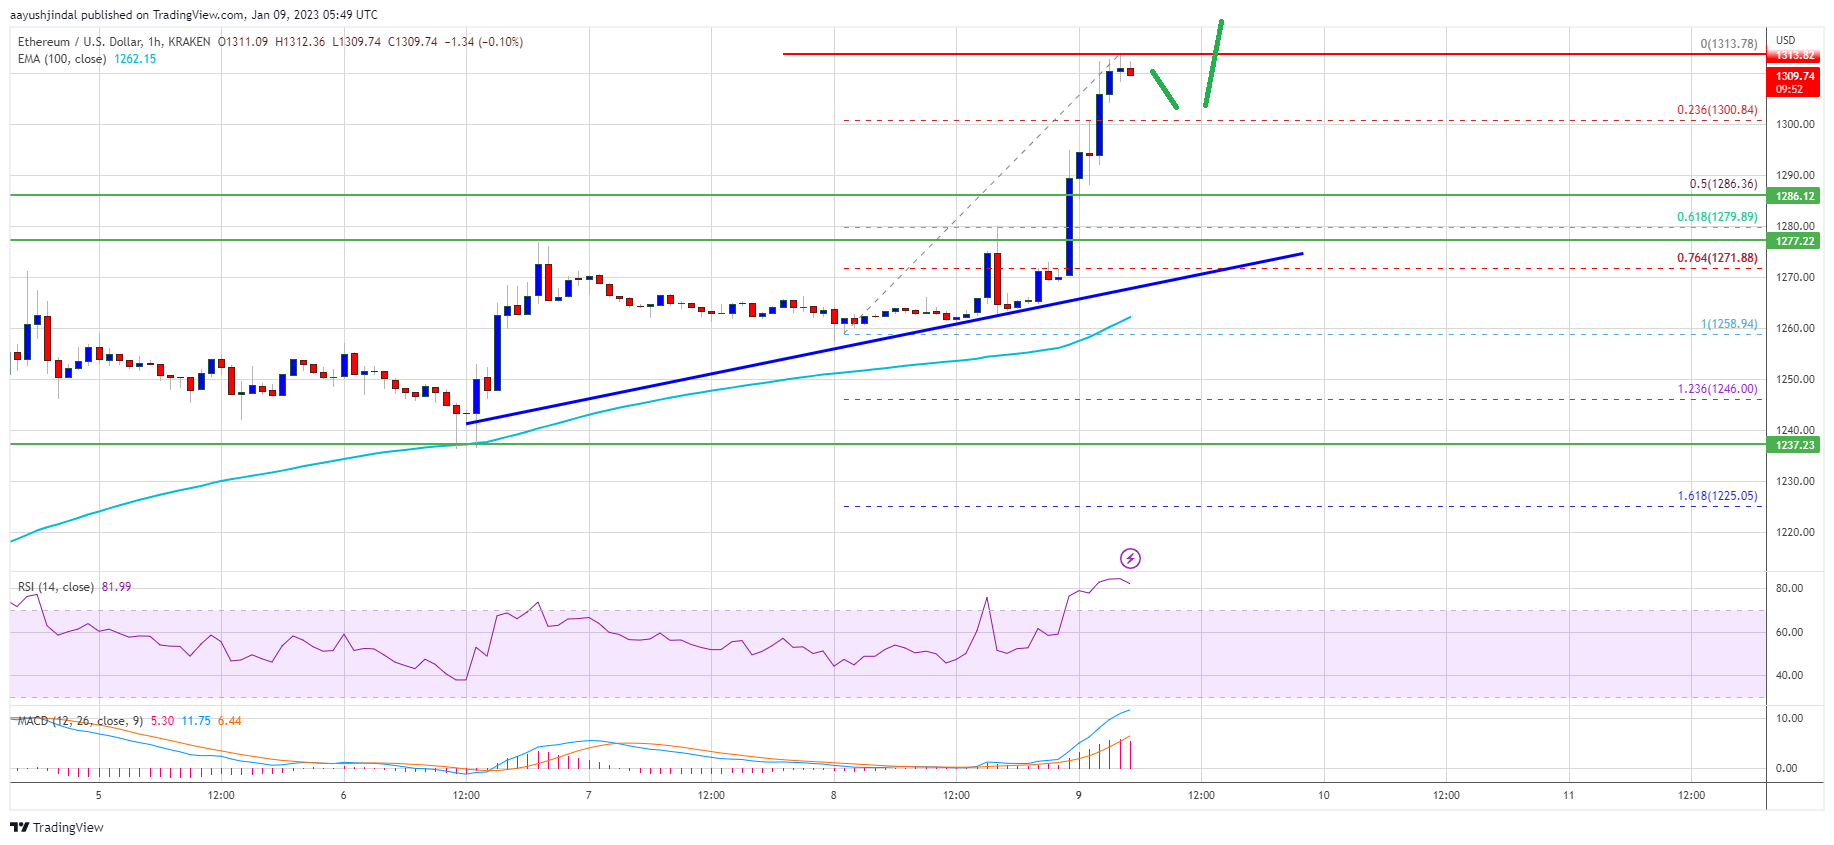
The price even broke the $1,300 barrier to move into a bullish zone. A high is formed near $1,313 and the price is now consolidating gains. Ether price is clearly showing a lot of bullish signs above $1,280 and the 100 hourly simple moving average.
There is also a key bullish trend line forming with support near $1,270 on the hourly chart of ETH/USD. It is positioned nicely above the 23.6% Fib retracement level of the recent rally from the $1,258 swing low to $1,313 high.
Source: ETHUSD on TradingView.com
An immediate resistance is near the $1,320 level. The next major resistance is near the $1,340 level. A clear move above the $1,340 resistance could another decent increase. In the stated case, the price may perhaps rise towards the $1,400 resistance. The next major resistance could be $1,450, above which the price could rise towards the $1,500 resistance zone.
Dips Limited in ETH?If ethereum fails to clear the $1,320 resistance, it could start a short-term downside correction. An initial support on the downside is near the $1,300 level.
The next major support is near the $1,270 level and the trend line. It is near the 61.8% Fib retracement level of the recent rally from the $1,258 swing low to $1,313 high. A downside break below the trend line support might send the price towards the $1,250 support. Any more losses might call for a test of the $1,220 zone.
Technical Indicators
Hourly MACD – The MACD for ETH/USD is now gaining momentum in the bullish zone.
Hourly RSI – The RSI for ETH/USD is now above the 50 level.
Major Support Level – $1,270
Major Resistance Level – $1,320
Original source
Read on NewsBTCRelated market context

Standard Chartered Says Bitcoin Bottomed Near $59,000 As Crypto Winter Ends
TL;DR Standard Chartered’s Geoffrey Kendrick reportedly says Bitcoin’s $59,000 area marked the cycle bottom. The note cites SpaceX...

Uranium Holds Above $85 as Mining ETF Rebounds From June Sell-Off
The latest charts display that the market is divided into stable physical prices and uranium shares trying to regain momentum afte...

Google Gemini AI Predicts Jaw-Dropping XRP Price For Next 90 Days
Google Gemini AI just put XRP back under the spotlight, predicting it is tightly wound for a major breakout toward $1.60 to $1.80...

Bitcoin price challenges $64,000 weekend wall – needing a breakout or risk a deeper correction
Bitcoin reclaimed $64,000 on June 12 and touched an intraday high of $64,301 in the same session that spot ETF flows finally flipp...

Bitcoin rises above $64,000 after Pakistan prime minister says Iran peace deal is near
Bitcoin traded above $64,000 on Saturday, supported by its strongest ETF inflows in a month and growing optimism around geopolitic...

Tether USDT Briefly Overtakes Ethereum in Market Cap: A $187B Wake-Up Call
For a few hours, earlier this week, Tether USDT stablecoin held a higher market cap than Ethereum, the first time that has happene...