Ethereum Price Climbs Toward $3,200 And Bulls Are Just Getting Started
Ethereum price is outperforming Bitcoin with a move above $3,000. ETH is showing bullish signs and might soon climb above the $3,200 resistance. Ethereum started a fresh increase above the $3,000 resistance zone. The pri...

Ethereum price is outperforming Bitcoin with a move above $3,000. ETH is showing bullish signs and might soon climb above the $3,200 resistance.
- Ethereum started a fresh increase above the $3,000 resistance zone.
- The price is trading above $3,050 and the 100-hourly Simple Moving Average.
- There is a key bullish trend line forming with support at $3,080 on the hourly chart of ETH/USD (data feed via Kraken).
- The pair could extend its increase toward $3,200 or even $3,250 in the near term.
Ethereum price remained stable above the $2,880 support zone. ETH formed a base and started a fresh increase above the $3,000 resistance. It gained nearly 5% and outperformed Bitcoin.
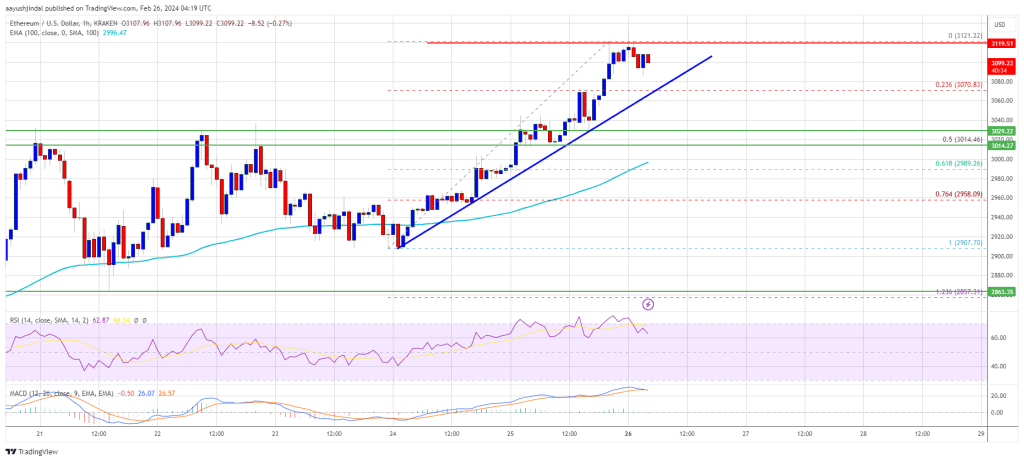
A new multi-week high is formed near $3,121 and the price is now consolidating gains. It is trading above the 23.6% Fib retracement level of the upward wave from the $2,907 swing low to the $3,121 high. There is also a key bullish trend line forming with support at $3,080 on the hourly chart of ETH/USD.
Ethereum is now trading above $3,085 and the 100-hourly Simple Moving Average. Immediate resistance on the upside is near the $3,120 level. The first major resistance is near the $3,150 level.
Source: ETHUSD on TradingView.com
The next major resistance is near $3,200, above which the price might gain bullish momentum. If there is a move above the $3,200 resistance, Ether could even rally toward the $3,280 resistance. Any more gains might call for a test of $3,320.
Are Dips Supported In ETH?If Ethereum fails to clear the $3,120 resistance, it could start a downside correction. Initial support on the downside is near the $3,080 level and the trend line.
The first major support is near the $3,000 zone. It is close to the 50% Fib retracement level of the upward wave from the $2,907 swing low to the $3,121 high, below which Ether might test the 100-hourly Simple Moving Average. The next key support could be the $2,960 zone. A clear move below the $2,960 support might send the price toward $2,920. Any more losses might send the price toward the $2,860 level.
Technical Indicators
Hourly MACD – The MACD for ETH/USD is losing momentum in the bullish zone.
Hourly RSI – The RSI for ETH/USD is now above the 50 level.
Major Support Level – $3,000
Major Resistance Level – $3,120
Original source
Read on NewsBTCRelated market context

Ethereum Price Prediction: ETH is Still Below Its 200 Week SMA, and Tom Lee Buying Spree Might End Soon
Ethereum price is trading above $1,700 after running for 5% today, and even our prediction model is calling for more leg higher. H...

BTC News Today: Bitcoin Climbs Toward $66K as Trump Reveals US-Iran Peace Deal
The renewed geopolitical optimism helped improve risk sentiment across financial markets, pushing Bitcoin back toward the $66,000...

XRP Price Analysis: Ripple Token Eyes 10% Gain with Flashing Bullish Pattern and ETF Inflows
XRP price posts 9% moves today from low $1.1 to $1.24, with a prediction that it could go even higher. Two independent tailwinds a...

Bitcoin Stabilizes Near Key Zone, But Glassnode Warns Capital Flows Remain Weak
Bitcoin’s rebound from the $60,000 area has given bulls something to work with, but Glassnode’s latest market read suggests the re...

Ethereum News: Last Chance to Buy Ethereum Under $2K? ETH USD Powers Up After Hormuz Peace Deal
In the latest Ethereum News, Ethereum ETH Price is trading at $1,739 up 4% in 24 hours, as risk assets catch a bid following the H...

XRP Price Prediction: US-Iran Peace Deal Fuels 13% XRP Surge, Analysts Target $1.94 Retest
The latest move saw XRP price today reclaim the $1.28 level for the first time in nearly two weeks. Market participants pointed to...