Ethereum Price Consolidate Gains and Seems Poised For Upside Break
Ethereum climbed higher above the $1,320 resistance zone against the US Dollar. ETH tested the $1,350 zone and is currently consolidating gains. Ethereum started a decent increase above the $1,300 and $1,320 resistance l...

Ethereum climbed higher above the $1,320 resistance zone against the US Dollar. ETH tested the $1,350 zone and is currently consolidating gains.
- Ethereum started a decent increase above the $1,300 and $1,320 resistance levels.
- The price is now trading above $1,320 and the 100 hourly simple moving average.
- There is a key bullish trend line forming with support near $1,295 on the hourly chart of ETH/USD (data feed via Kraken).
- The pair could start another increase if it stays above the $1,280 support zone.
Ethereum price started a decent increase above the $1,300 resistance. ETH was able to settle above the $1,300 resistance zone and gained pace for a move above $1,320, similar to bitcoin above $17,000.
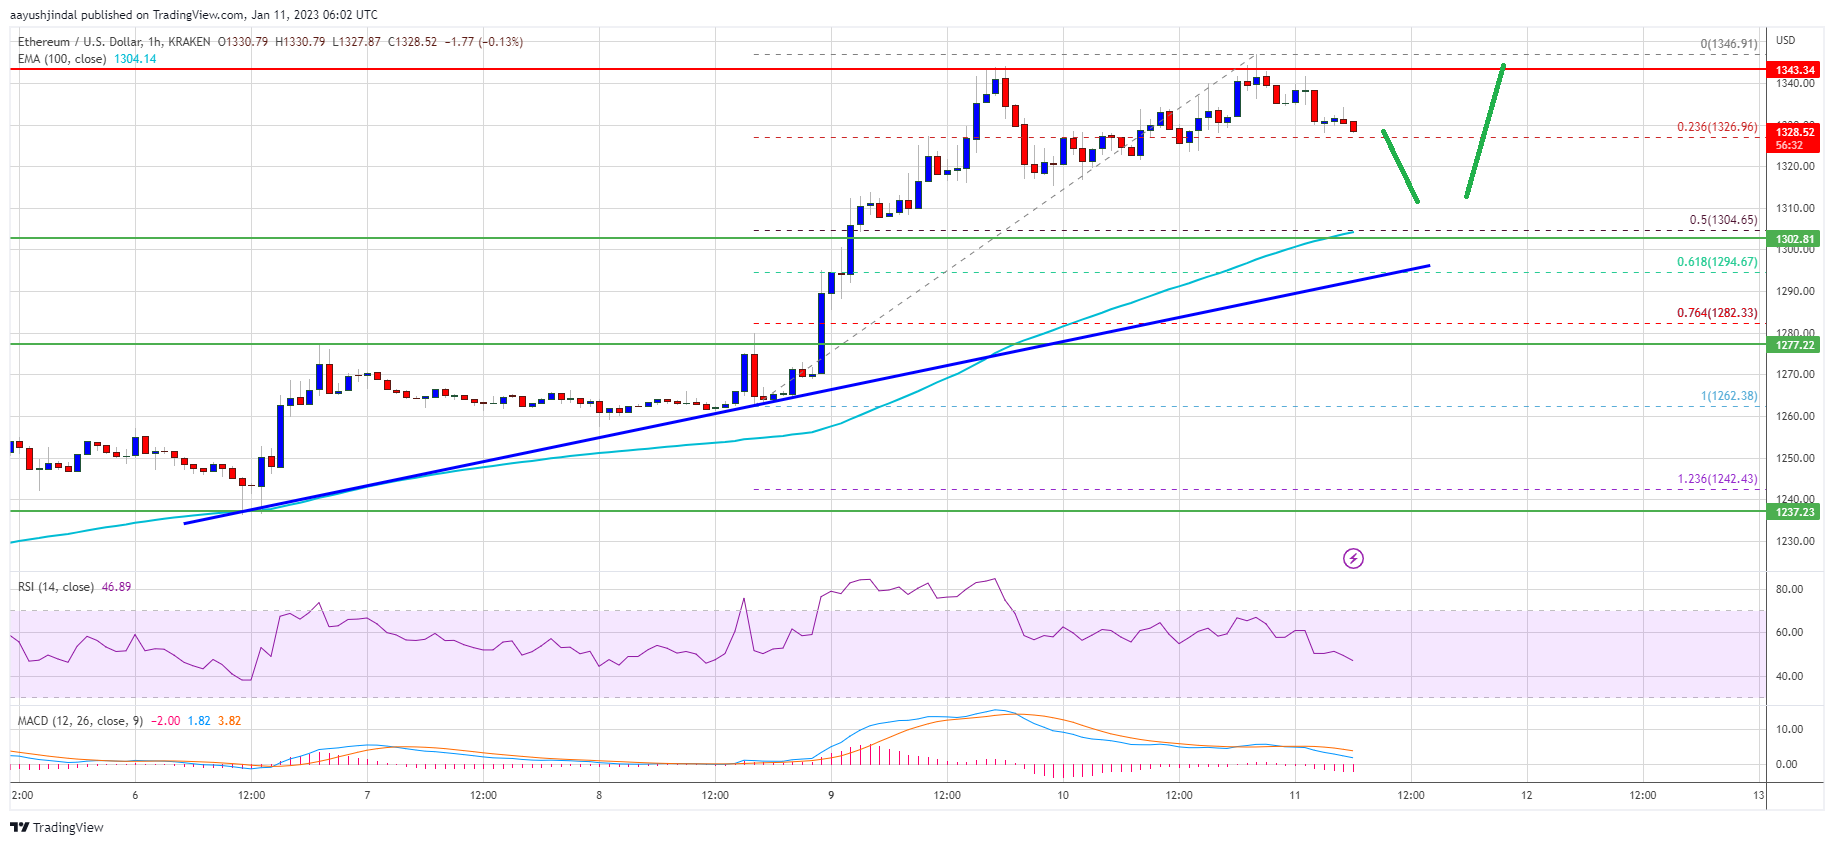
The bulls pushed the price towards the $1,350 resistance zone. A high was formed near $1,346 and the price is now consolidating gains. It is approaching the 23.6% Fib retracement level of the upward wave from the $1,263 swing low to $1,346 high.
Ether is now trading above $1,320 and the 100 hourly simple moving average. There is also a key bullish trend line forming with support near $1,295 on the hourly chart of ETH/USD.
Source: ETHUSD on TradingView.com
An immediate resistance is near the $1,340 level. The next major resistance is near the $1,350 level. A proper close above the $1,350 resistance could another decent increase. In the stated case, the price may perhaps climb higher towards the $1,420 resistance. Any more gains might send the price towards $1,500, above which the price could rise towards the $1,650 resistance zone.
Dips Limited in ETH?If ethereum fails to clear the $1,340 resistance, it could start a downside correction. An initial support on the downside is near the $1,320 level.
The next major support is near the $1,300 level and the trend line. It is near the 50% Fib retracement level of the upward wave from the $1,263 swing low to $1,346 high. A downside break below the trend line support might send the price towards the $1,280 support. Any more losses might call for a test of the $1,250 zone.
Technical Indicators
Hourly MACD – The MACD for ETH/USD is now losing momentum in the bullish zone.
Hourly RSI – The RSI for ETH/USD is now below the 50 level.
Major Support Level – $1,280
Major Resistance Level – $1,340
Original source
Read on NewsBTCRelated market context

Uranium Holds Above $85 as Mining ETF Rebounds From June Sell-Off
The latest charts display that the market is divided into stable physical prices and uranium shares trying to regain momentum afte...

Standard Chartered Says Bitcoin Bottomed Near $59,000 As Crypto Winter Ends
TL;DR Standard Chartered’s Geoffrey Kendrick reportedly says Bitcoin’s $59,000 area marked the cycle bottom. The note cites SpaceX...

Tether USDT Briefly Overtakes Ethereum in Market Cap: A $187B Wake-Up Call
For a few hours, earlier this week, Tether USDT stablecoin held a higher market cap than Ethereum, the first time that has happene...

Google Gemini AI Predicts Jaw-Dropping XRP Price For Next 90 Days
Google Gemini AI just put XRP back under the spotlight, predicting it is tightly wound for a major breakout toward $1.60 to $1.80...

Bitcoin rises above $64,000 after Pakistan prime minister says Iran peace deal is near
Bitcoin traded above $64,000 on Saturday, supported by its strongest ETF inflows in a month and growing optimism around geopolitic...

Elon Musk SpaceX AI Predicts Incredible Bitcoin Price For Next 30 Days
Here is the thing about capitulation calls. They only sound smart in hindsight. Right now, with Bitcoin price scraping along the l...