Ethereum Price Could Resume Decline If This Support Paves Way
Ethereum started a fresh decline from the $1,230 resistance against the US Dollar. ETH could accelerate lower if there is a clear move below the $1,180 support. Ethereum is showing bearish signs and trading well below th...

Ethereum started a fresh decline from the $1,230 resistance against the US Dollar. ETH could accelerate lower if there is a clear move below the $1,180 support.
- Ethereum is showing bearish signs and trading well below the $1,230 resistance zone.
- The price is now trading below $1,200 and the 100 hourly simple moving average.
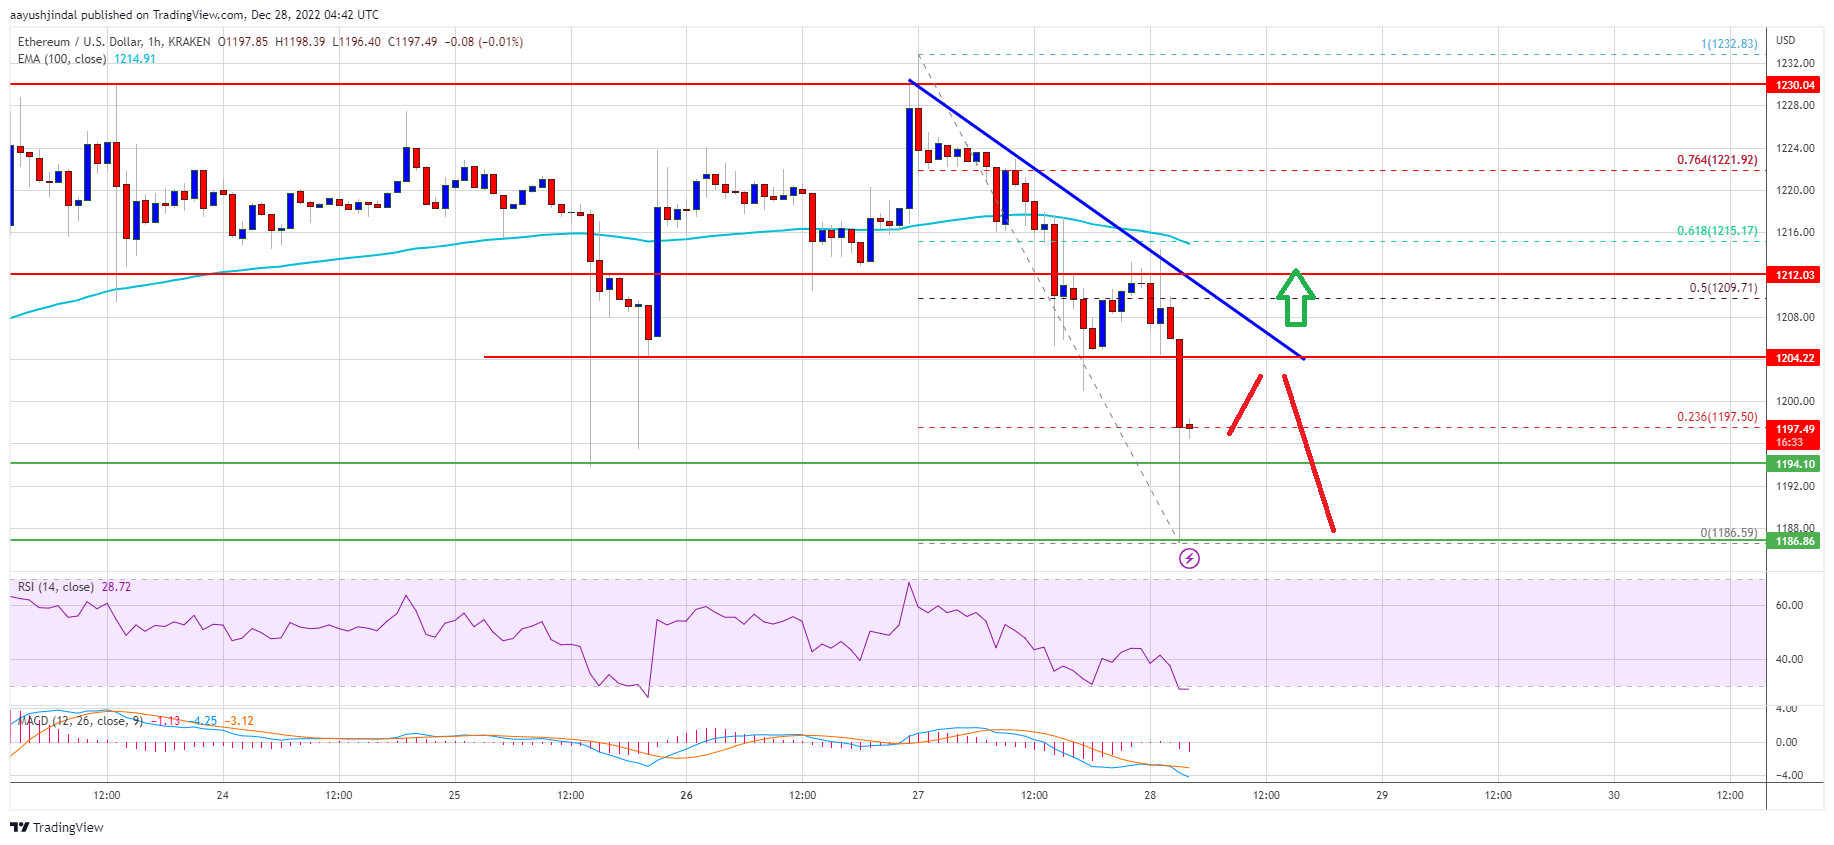
- There is a key bearish trend line forming with resistance near $1,205 on the hourly chart of ETH/USD (data feed via Kraken).
- The pair could continue to move down if there is a clear move below the $1,185 support.
Ethereum price struggled to clear the key $1,230 resistance zone. ETH formed a high near the $1,232 before it started another decline. There was a clear move below the $1,210 support zone and the 100 hourly simple moving average, similar to bitcoin.
The price even declined below the $1,200 support zone. It retested the $1,185 support zone. A low is formed near $1,186 and the price is now consolidating losses.
Ether price is now trading below $1,200 and the 100 hourly simple moving average. There is also a key bearish trend line forming with resistance near $1,205 on the hourly chart of ETH/USD.
An immediate resistance is near the $1,200 level. It is near the 23.6% Fib retracement level of the recent decline from the $1,232 swing high to $1,186 low. The next major resistance is near the $1,210 level and the trend line. The first major resistance is near $1,215.
The 61.8% Fib retracement level of the recent decline from the $1,232 swing high to $1,186 low is also near the $1,215 level. A close above the $1,215 resistance could start a steady increase. In the stated case, the price may perhaps rise towards the $1,230 resistance.
Source: ETHUSD on TradingView.com
The next major resistance could be $1,250, above which the price could accelerate higher towards $1,300. Any more gains might send the price towards the $1,350 resistance zone.
More Losses in ETH?If ethereum fails to climb above the $1,215 resistance, it could start another drop. An initial support on the downside is near the $1,185 level.
The next major support is near the $1,165 level. A downside break below $1,165 might spark a move towards the $1,100 support. Any more losses could lead the price towards the $1,055 zone.
Technical Indicators
Hourly MACD – The MACD for ETH/USD is now gaining momentum in the bearish zone.
Hourly RSI – The RSI for ETH/USD is now below the 50 level.
Major Support Level – $1,185
Major Resistance Level – $1,215
Original source
Read on NewsBTCRelated market context

Tether USDT Briefly Overtakes Ethereum in Market Cap: A $187B Wake-Up Call
For a few hours, earlier this week, Tether USDT stablecoin held a higher market cap than Ethereum, the first time that has happene...

Standard Chartered Says Bitcoin Bottomed Near $59,000 As Crypto Winter Ends
TL;DR Standard Chartered’s Geoffrey Kendrick reportedly says Bitcoin’s $59,000 area marked the cycle bottom. The note cites SpaceX...

Uranium Holds Above $85 as Mining ETF Rebounds From June Sell-Off
The latest charts display that the market is divided into stable physical prices and uranium shares trying to regain momentum afte...

Crypto Today: Bitcoin ETF Rumours, Ethereum Strength, and Mining Heat for Canadian Homes
Bitcoin ETF rumours lift sentiment, Ethereum recaptures $3,800, and North Vancouver uses mining heat for homes. Coinbase unveils p...

Google Gemini AI Predicts Jaw-Dropping XRP Price For Next 90 Days
Google Gemini AI just put XRP back under the spotlight, predicting it is tightly wound for a major breakout toward $1.60 to $1.80...

Bitcoin price challenges $64,000 weekend wall – needing a breakout or risk a deeper correction
Bitcoin reclaimed $64,000 on June 12 and touched an intraday high of $64,301 in the same session that spot ETF flows finally flipp...