Ethereum Price Drops 6% and Signals Risk of Trend Change Below This Support
Ethereum started a downside correction below $1,600 against the US Dollar. ETH is down over 6% and remains at a risk of a drop below the $1,480 support. Ethereum is showing a few bearish signs below the $1,600 and $1,580...

Ethereum started a downside correction below $1,600 against the US Dollar. ETH is down over 6% and remains at a risk of a drop below the $1,480 support.
- Ethereum is showing a few bearish signs below the $1,600 and $1,580 levels.
- The price is now trading below $1,600 and the 100 hourly simple moving average.
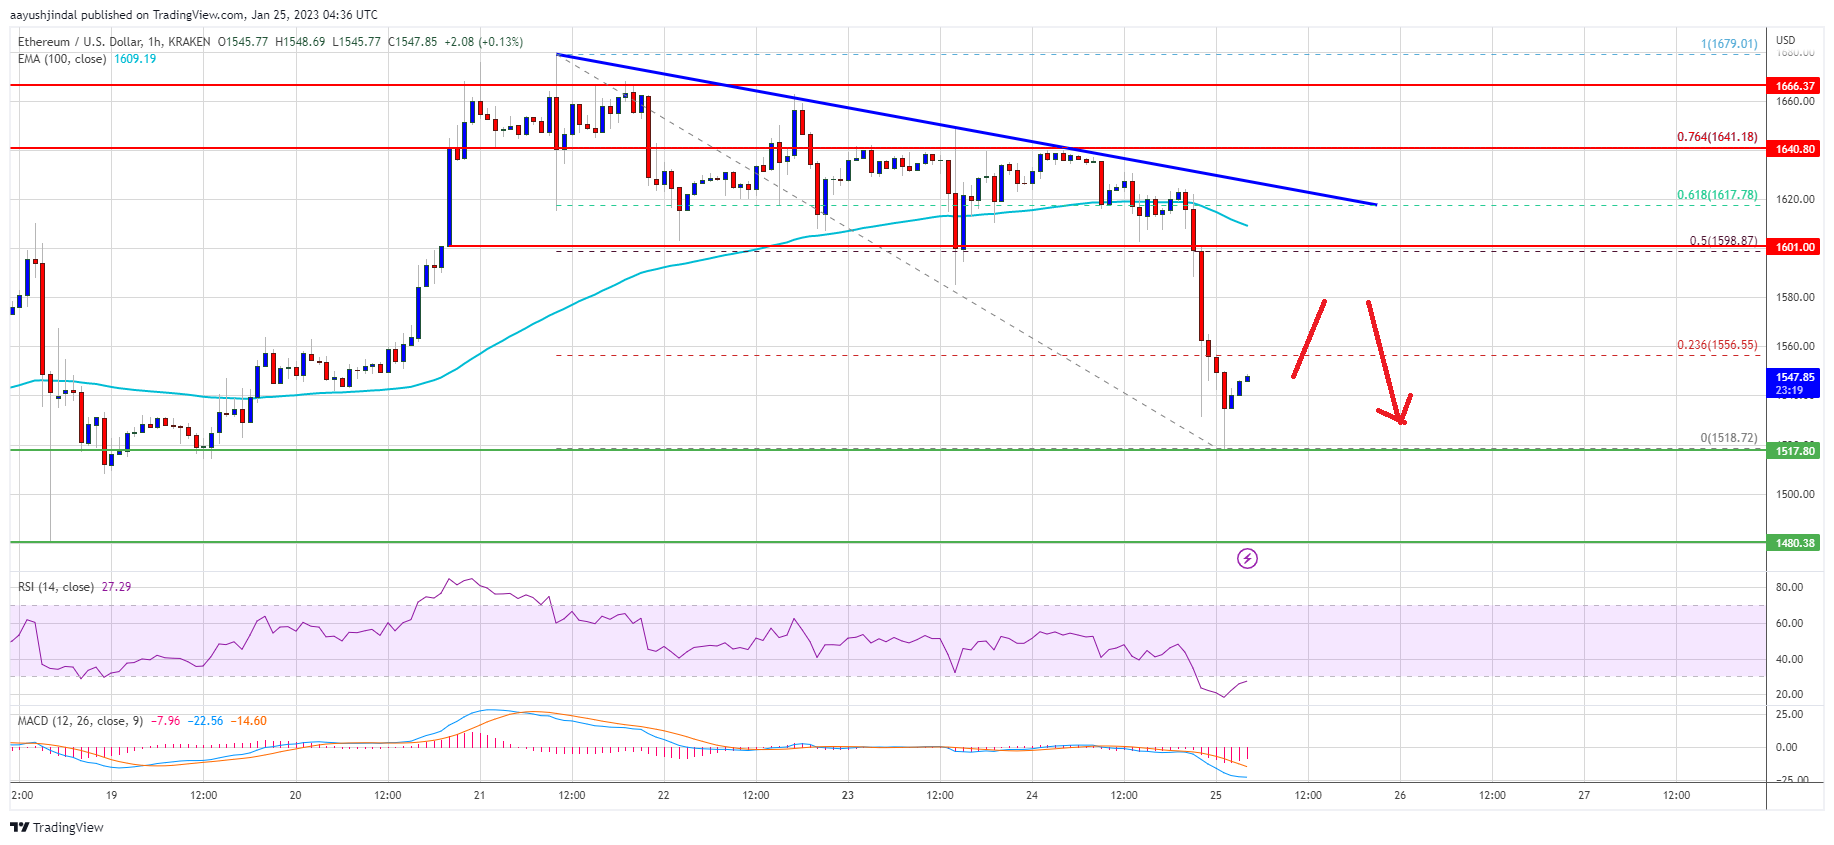
- There is a key bearish trend line forming with resistance near $1,620 on the hourly chart of ETH/USD (data feed via Kraken).
- The pair could recover if it stays above the $1,500 and $1,480 support levels.
Ethereum price failed to clear the $1,650 resistance zone. ETH corrected lower below the $1,620 and $1,600 level, similar to bitcoin. The decline gained pace below the 50% Fib retracement level of the upward move from the $1,480 swing low to $1,680 high.
The price declined over 6% in a day and traded below the $1,550 support zone. A low is formed near $1,518 and the price is now consolidating losses.
Ether price is now trading below $1,600 and the 100 hourly simple moving average. An immediate resistance is near the $1,555 level. It is near the 23.6% Fib retracement level of the recent decline from the $1,680 swing high to $1,518 low.
The next major resistance is near the $1,660 level. It is close to the 50% Fib retracement level of the recent decline from the $1,680 swing high to $1,518 low. There is also a key bearish trend line forming with resistance near $1,620 on the hourly chart of ETH/USD.
Source: ETHUSD on TradingView.com
An upside break above the $1,620 resistance zone could start a fresh rally. In the stated case, the price may perhaps rise towards the $1,680 resistance.
More Losses in ETH?If ethereum fails to clear the $1,600 resistance, it could continue to move down. An initial support on the downside is near the $1,520 level or the recent low.
The next major support is near the $1,480 level. If there is a break below $1,480, the price might drop towards the $1,420 support. Any more losses might call for a test of the $1,350 zone.
Technical Indicators
Hourly MACD – The MACD for ETH/USD is now gaining momentum in the bearish zone.
Hourly RSI – The RSI for ETH/USD is now below the 50 level.
Major Support Level – $1,480
Major Resistance Level – $1,600
Original source
Read on NewsBTCRelated market context

Tether USDT Briefly Overtakes Ethereum in Market Cap: A $187B Wake-Up Call
For a few hours, earlier this week, Tether USDT stablecoin held a higher market cap than Ethereum, the first time that has happene...

Google Gemini AI Predicts Jaw-Dropping XRP Price For Next 90 Days
Google Gemini AI just put XRP back under the spotlight, predicting it is tightly wound for a major breakout toward $1.60 to $1.80...

Standard Chartered Says Bitcoin Bottomed Near $59,000 As Crypto Winter Ends
TL;DR Standard Chartered’s Geoffrey Kendrick reportedly says Bitcoin’s $59,000 area marked the cycle bottom. The note cites SpaceX...

Crypto Today: Bitcoin ETF Rumours, Ethereum Strength, and Mining Heat for Canadian Homes
Bitcoin ETF rumours lift sentiment, Ethereum recaptures $3,800, and North Vancouver uses mining heat for homes. Coinbase unveils p...

Michael Saylor says investor confidence in Ethereum has collapsed
Ethereum's declining investor confidence signals a shift towards Bitcoin dominance, emphasizing real-world utility over speculativ...

Blackrock’s IBIT Leads $86 Million Bitcoin ETF Inflow as Ethereum Funds Extend Outflow Streak
Spot bitcoin exchange-traded funds (ETFs) drew $85.85 million in net inflows on Friday, with every one of the 12 tracked funds avo...