Ethereum Price Eyes Fresh Rally Unless ETH Dips Below This Support
Ethereum is showing positive signs above the $1,550 zone against the US Dollar. ETH could start a fresh rally unless it breaks the $1,550 support zone. Ethereum is consolidating and is showing positive signs above the $1...

Ethereum is showing positive signs above the $1,550 zone against the US Dollar. ETH could start a fresh rally unless it breaks the $1,550 support zone.
- Ethereum is consolidating and is showing positive signs above the $1,550 support zone.
- The price is now trading above $1,550 and the 100 hourly simple moving average.
- There is a key contracting triangle forming with resistance near $1,600 on the hourly chart of ETH/USD (data feed via Kraken).
- The pair could start a fresh surge if it clears the $1,600 and $1,620 levels.
Ethereum remained well bid after it started a downside correction from the $1,665 zone. ETH declined below the $1,580 level, but the bulls were active near the $1,550 level.
The price tested the key 61.8% Fib retracement level of the main increase from the $1,485 swing low to $1,665 high. The bulls defended more losses below the $1,550 support zone and the 100 hourly simple moving average. It is now back above the $1,580 level and is consolidating.
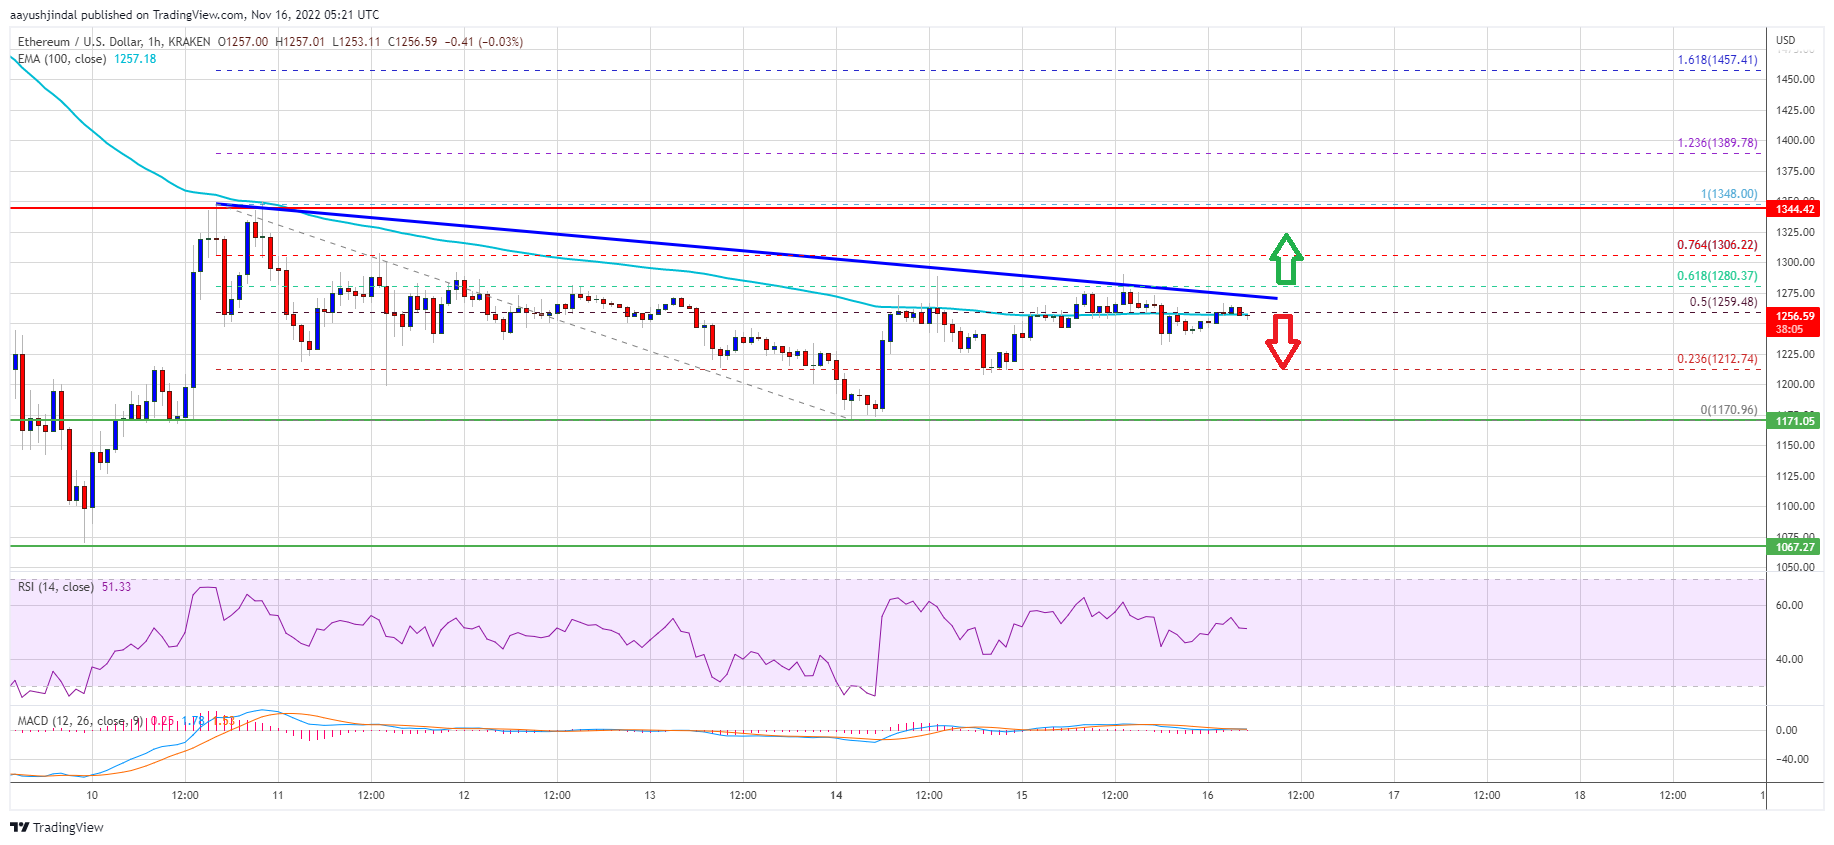
There is also a key contracting triangle forming with resistance near $1,600 on the hourly chart of ETH/USD. An immediate resistance on the upside is near the $1,600 level and the triangle trend line zone.
Source: ETHUSD on TradingView.com
The first major resistance is near the $1,620 and $1,625 levels, above which the price could revisit the $1,665 high. A clear break above $1,665 level could set the stage for a fresh rally. In the stated case, the price could even test the $1,750 level. Any more gains might send the price toward the $1,800 resistance zone.
Downside Break in ETH?If ethereum fails to climb above the $1,600 resistance, it could slowly move lower. An initial support on the downside is near the $1,570 level and the 100 hourly simple moving average.
The first major support is near the $1,550 level. A downside break below the $1,550 zone might call for a test of the 76% Fib retracement level of the main increase from the $1,485 swing low to $1,665 high. Any more losses may perhaps send the price towards the $1,485 support zone in the near term.
Technical Indicators
Hourly MACD – The MACD for ETH/USD is now losing momentum in the bearish zone.
Hourly RSI – The RSI for ETH/USD is now above the 50 level.
Major Support Level – $1,550
Major Resistance Level – $1,600
Original source
Read on NewsBTCRelated market context

Uranium Holds Above $85 as Mining ETF Rebounds From June Sell-Off
The latest charts display that the market is divided into stable physical prices and uranium shares trying to regain momentum afte...

Bitcoin price challenges $64,000 weekend wall – needing a breakout or risk a deeper correction
Bitcoin reclaimed $64,000 on June 12 and touched an intraday high of $64,301 in the same session that spot ETF flows finally flipp...

Standard Chartered Says Bitcoin Bottomed Near $59,000 As Crypto Winter Ends
TL;DR Standard Chartered’s Geoffrey Kendrick reportedly says Bitcoin’s $59,000 area marked the cycle bottom. The note cites SpaceX...

Elon Musk SpaceX AI Predicts Incredible Bitcoin Price For Next 30 Days
Here is the thing about capitulation calls. They only sound smart in hindsight. Right now, with Bitcoin price scraping along the l...

Bitcoin Mining Cost Model Points To $47,000 Floor, But Analysts Urge Caution
TL;DR Crypto Rover says Bitcoin has never bottomed below electrical production cost, currently estimated at $47,000. Mining-cost m...

Bitcoin rises above $64,000 after Pakistan prime minister says Iran peace deal is near
Bitcoin traded above $64,000 on Saturday, supported by its strongest ETF inflows in a month and growing optimism around geopolitic...