Ethereum Price Faces Crucial Test: Will $1,570 Withstand the Pressure?
Ethereum price started a steady increase from the $1,520 zone against the US dollar. ETH is now struggling to clear the $1,605 and $1,620 resistance levels. Ethereum is attempting a recovery wave above the $1,570 level....

Ethereum price started a steady increase from the $1,520 zone against the US dollar. ETH is now struggling to clear the $1,605 and $1,620 resistance levels.
- Ethereum is attempting a recovery wave above the $1,570 level.
- The price is trading just above $1,575 and the 100-hourly Simple Moving Average.
- There is a key bullish trend line forming with support near $1,572 on the hourly chart of ETH/USD (data feed via Kraken).
- The pair could rise further if there is a close above the $1,620 resistance level.
Ethereum started a fresh increase from the $1,520 level. ETH gained traction like Bitcoin and spiked above the $1,600 resistance level. It even climbed above $1,620, but the bears appeared near $1,650.
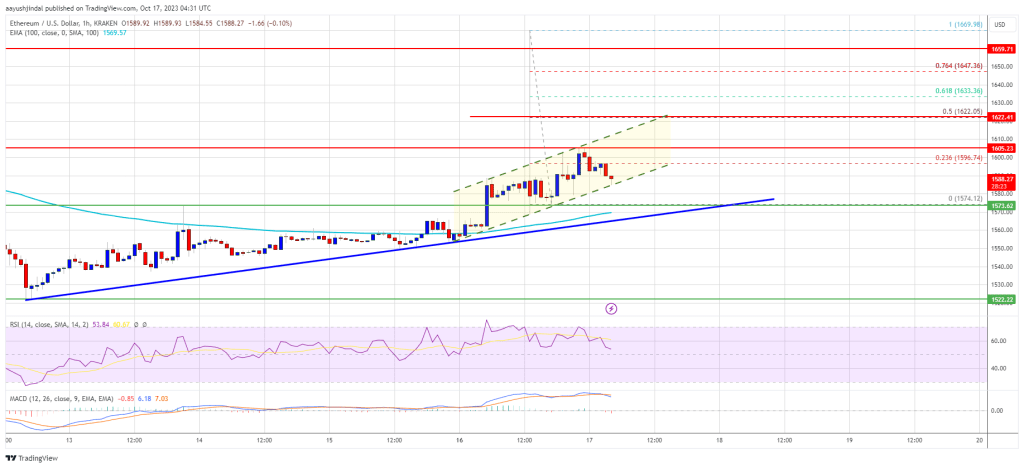
A high was formed near $1,669 before there was a fresh decline. Ether trimmed gains and settled below the $1,600 level. It tested the $1,575 support and is currently consolidating near the 23.6% Fib retracement level of the recent decline from the $1,669 swing high to the $1,574 low.
Ethereum is now trading just above $1,575 and the 100-hourly Simple Moving Average. There is also a key bullish trend line forming with support near $1,572 on the hourly chart of ETH/USD.
On the upside, the price is facing resistance near the $1,605 level. The first major resistance is near the 50% Fib retracement level of the recent decline from the $1,669 swing high to the $1,574 low at $1,620. A close above the $1,620 resistance might start a decent increase.
Source: ETHUSD on TradingView.com
In the stated case, Ether could rise and recover toward the $1,665 resistance. Any more gains might open the doors for a move toward $1,750.
Another Decline in ETH?If Ethereum fails to clear the $1,605 resistance, it could start another decline. Initial support on the downside is near the $1,575 level and the 100-hourly Simple Moving Average.
The next key support is $1,550. A downside break below the $1,550 support might send the price further lower. In the stated case, the price could drop toward the $1,520 level. Any more losses may perhaps send Ether toward the $1,440 level.
Technical Indicators
Hourly MACD – The MACD for ETH/USD is losing momentum in the bullish zone.
Hourly RSI – The RSI for ETH/USD is now above the 50 level.
Major Support Level – $1,575
Major Resistance Level – $1,620
Original source
Read on NewsBTCRelated market context

Uranium Holds Above $85 as Mining ETF Rebounds From June Sell-Off
The latest charts display that the market is divided into stable physical prices and uranium shares trying to regain momentum afte...

Tether USDT Briefly Overtakes Ethereum in Market Cap: A $187B Wake-Up Call
For a few hours, earlier this week, Tether USDT stablecoin held a higher market cap than Ethereum, the first time that has happene...

Standard Chartered Says Bitcoin Bottomed Near $59,000 As Crypto Winter Ends
TL;DR Standard Chartered’s Geoffrey Kendrick reportedly says Bitcoin’s $59,000 area marked the cycle bottom. The note cites SpaceX...

Michael Saylor says investor confidence in Ethereum has collapsed
Ethereum's declining investor confidence signals a shift towards Bitcoin dominance, emphasizing real-world utility over speculativ...

Crypto Today: Bitcoin ETF Rumours, Ethereum Strength, and Mining Heat for Canadian Homes
Bitcoin ETF rumours lift sentiment, Ethereum recaptures $3,800, and North Vancouver uses mining heat for homes. Coinbase unveils p...

Blackrock’s IBIT Leads $86 Million Bitcoin ETF Inflow as Ethereum Funds Extend Outflow Streak
Spot bitcoin exchange-traded funds (ETFs) drew $85.85 million in net inflows on Friday, with every one of the 12 tracked funds avo...