Ethereum Price Flashes Bearish Bias, Bulls Lose Short-Term Control
Ethereum price failed to continue higher above $3,000 and dipped. ETH is now showing bearish signs and might slide further below $2,880. Ethereum started a fresh decline below $3,000 and $2,980. The price is trading belo...
Archive context
Older archive item. Useful for background and entity history, but not a fresh market-moving signal.

Ethereum price failed to continue higher above $3,000 and dipped. ETH is now showing bearish signs and might slide further below $2,880.
- Ethereum started a fresh decline below $3,000 and $2,980.
- The price is trading below $2,950 and the 100-hourly Simple Moving Average.
- There was a break below a rising channel with support at $2,980 on the hourly chart of ETH/USD (data feed via Kraken).
- The pair could continue to move down if it settles below the $2,880 zone.
Ethereum price failed to stay above the $3,000 pivot level and started a fresh decline, like Bitcoin. ETH price dipped below $2,980 to enter a bearish zone.
The bears were able to push the price below the 50% Fib retracement level of the upward move from the $2,775 swing low to the $3,075 high. Besides, there was a break below a rising channel with support at $2,980 on the hourly chart of ETH/USD.
Ethereum price is now trading below $2,980 and the 100-hourly Simple Moving Average. If the bulls are able to protect more losses below $2,880, the price could start a fresh recovery.
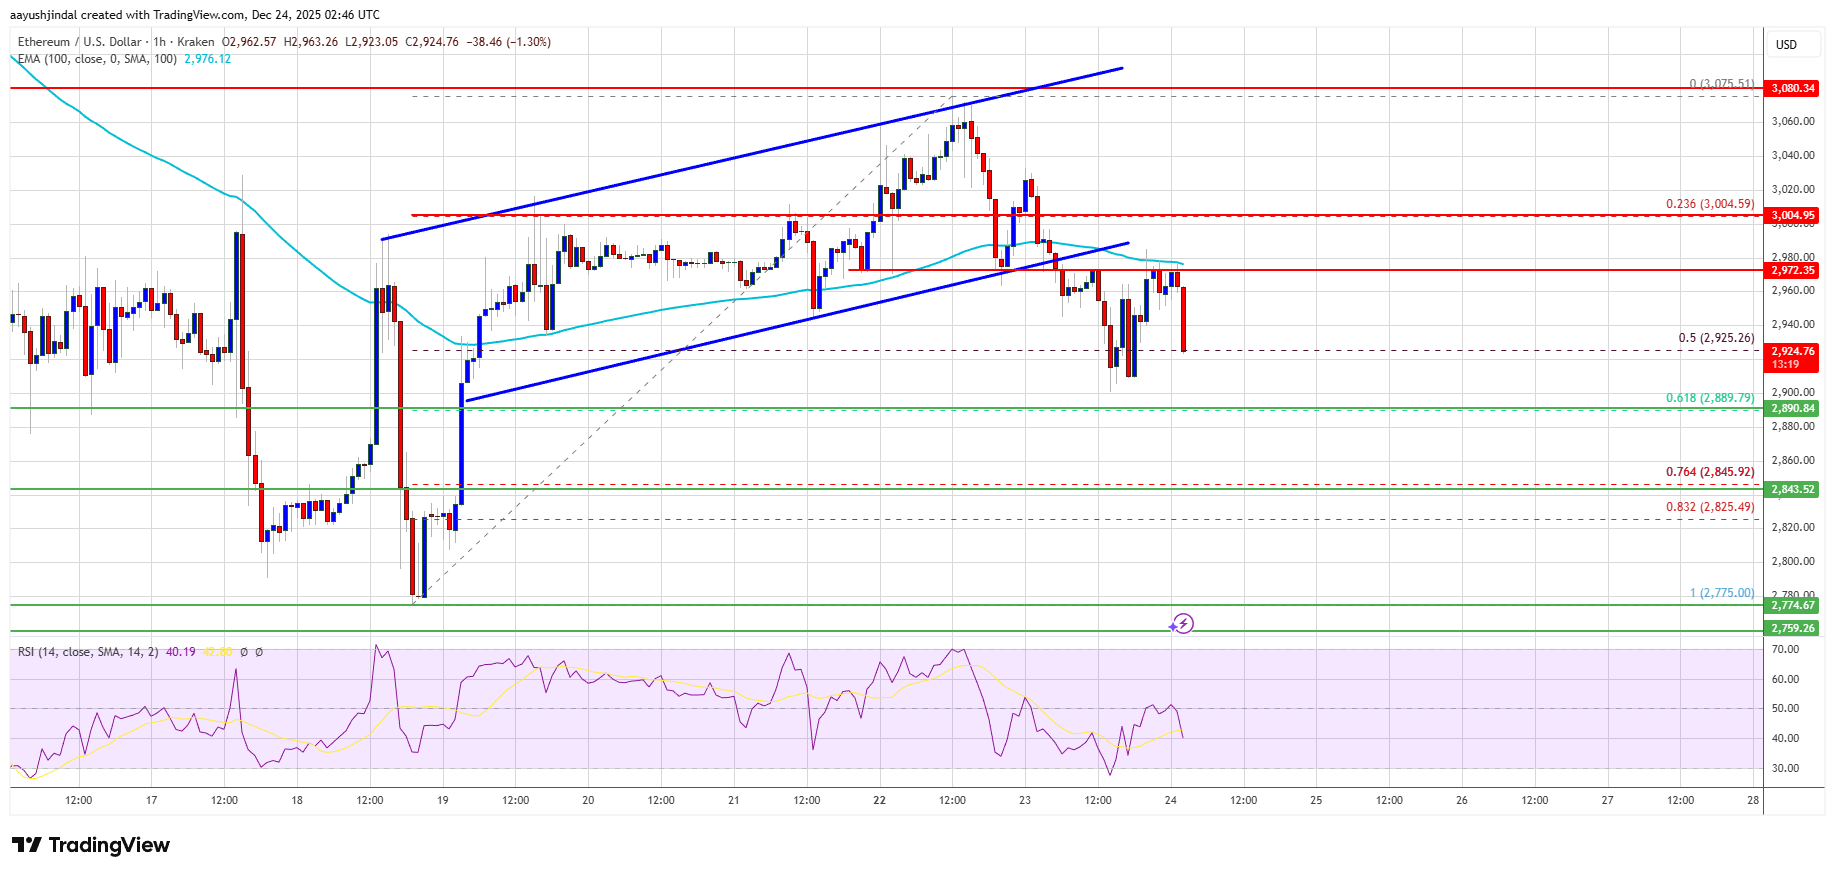
Immediate resistance is seen near the $2,980 level. The first key resistance is near the $3,000 level. The next major resistance is near the $3,050 level. A clear move above the $3,050 resistance might send the price toward the $3,120 resistance. An upside break above the $3,120 region might call for more gains in the coming days. In the stated case, Ether could rise toward the $3,200 resistance zone or even $3,220 in the near term.
More Losses In ETH?If Ethereum fails to clear the $3,000 resistance, it could start a fresh decline. Initial support on the downside is near the $2,880 level and the 61.8% Fib retracement level of the upward move from the $2,775 swing low to the $3,075 high.
The first major support sits near the $2,845 zone. A clear move below the $2,845 support might push the price toward the $2,800 support. Any more losses might send the price toward the $2,775 region. The next key support sits at $2,720.
Technical Indicators
Hourly MACD – The MACD for ETH/USD is gaining momentum in the bearish zone.
Hourly RSI – The RSI for ETH/USD is now below the 50 zone.
Major Support Level – $2,880
Major Resistance Level – $3,000
Why this matters
This ethereum story adds another data point to the current market tape and is useful when read alongside nearby source coverage.
Original source
Read on NewsBTCRelated market context

BTC USD Fights For $85K: Bitcoin Price Prediction Says $90K Still in Play
Bitcoin is trading at $85,954, down 0.8% on the day after briefly tagging $86,922 earlier in the session. That pullback from the h...

Bitcoin clears $86,000 as $1B in shorts liquidated again – battle now shifts to $90k
Bitcoin’s break above $86,000 has cleared a major pocket of bearish leverage and put $90,000 back in traders’ sights. The largest...

Vitalik Buterin Backs Trueo's Ethereum Move As TRUE Jumps 900%
Vitalik Buterin endorsed a prediction market by name on Monday, welcoming Trueo's plan to move its primary deployment from Base to...

Bitcoin ETFs just absorbed 11,500 BTC in their biggest buying day in nearly two years
US spot Bitcoin exchange-traded funds (ETFs) pulled in nearly $1 billion as BTC broke above $86,000, marking their strongest inflo...

Bitcoin Investors Buy Nearly $1B in BTC ETFs as Bull Market Returns
Bitcoin Magazine Bitcoin Investors Buy Nearly $1B in BTC ETFs as Bull Market Returns The Bitcoin bulls are back — if ETF flows are...

Massive ETF capital exits threaten Bitcoin’s fragile $86,000 price surge
Bitcoin’s 11.65% weekly rebound now carries evidence of genuine spot and on-chain participation, widening a move that began with h...