Ethereum Price Forms Bullish Continuation Pattern and Could Rally Again
Ethereum is consolidating gains above $1,600 against the US Dollar. ETH is showing positive signs and might start another increase above $1,650. Ethereum is showing positive signs above the $1,620 and $1,600 levels. The...

Ethereum is consolidating gains above $1,600 against the US Dollar. ETH is showing positive signs and might start another increase above $1,650.
- Ethereum is showing positive signs above the $1,620 and $1,600 levels.
- The price is now trading above $1,600 and the 100 hourly simple moving average.
- There is a key bullish flag forming with resistance near $1,640 on the hourly chart of ETH/USD (data feed via Kraken).
- The pair could rally again if it clears the $1,640 and $1,650 resistance levels.
Ethereum price started a downside correction from the $1,680 resistance zone. ETH corrected lower below the $1,650 and $1,620 level, similar to bitcoin.
The price declined below the 23.6% Fib retracement level of the upward wave from the $1,481 swing low to $1,680 high. There was a sharp decline below the $1,620 level and the 100 hourly simple moving average. However, the price remained stable near the $1,600 level.
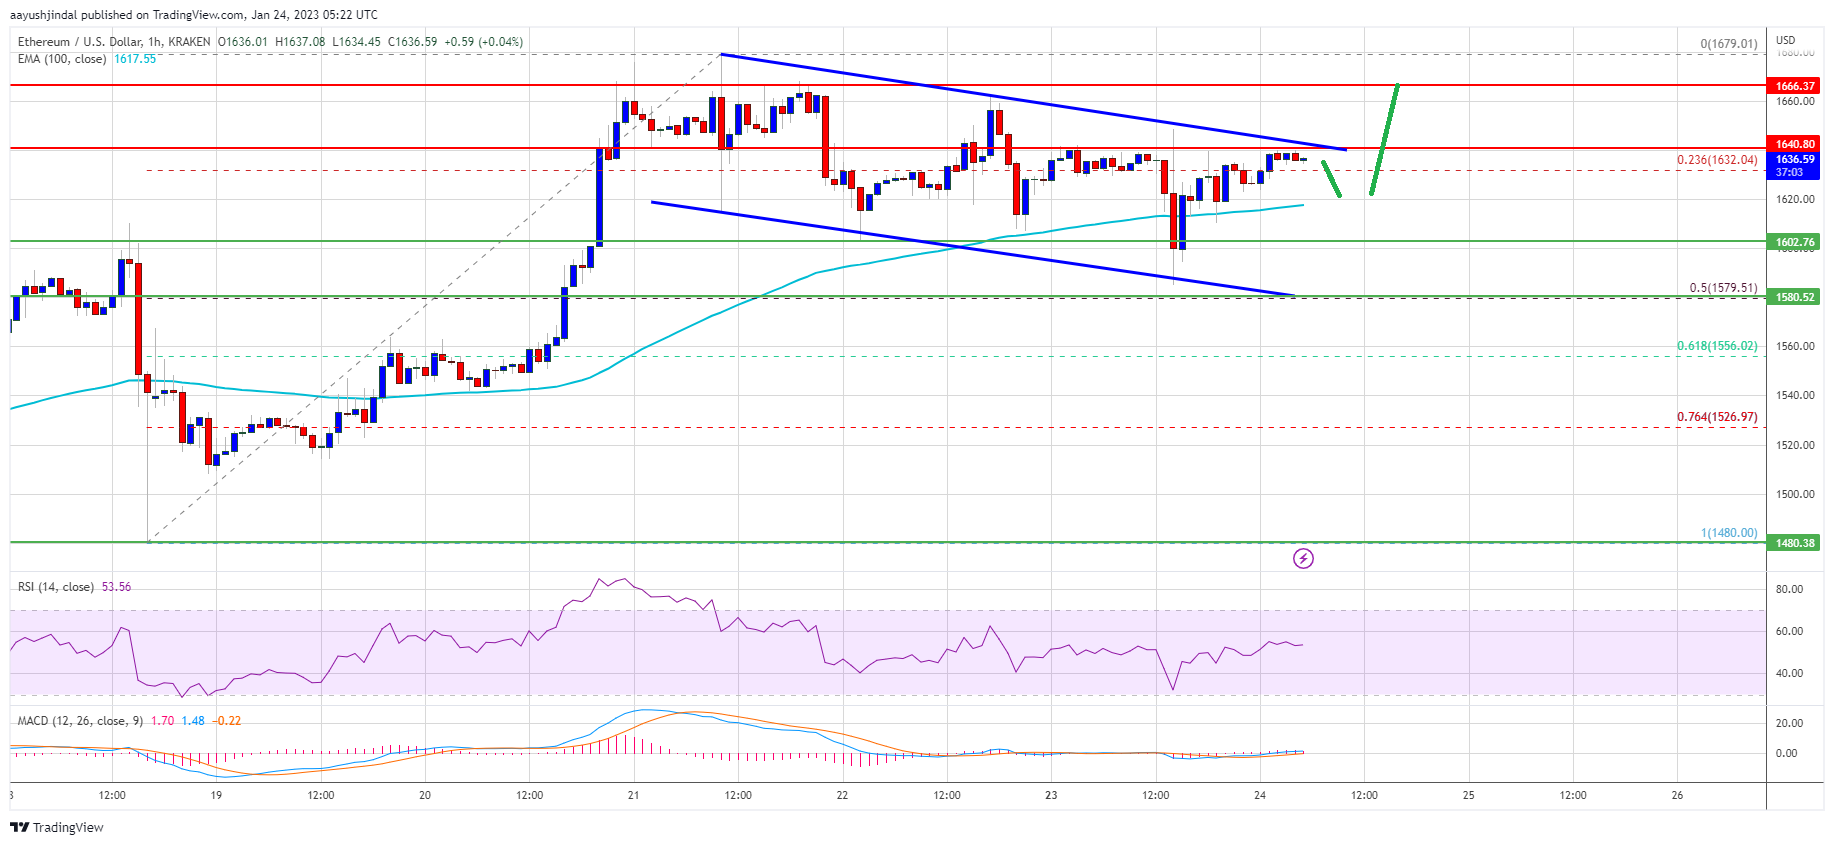
Ether price is now trading above $1,600 and the 100 hourly simple moving average. There is also a key bullish flag forming with resistance near $1,640 on the hourly chart of ETH/USD.
Source: ETHUSD on TradingView.com
An immediate resistance is near the $1,640 level and the channel resistance. The next major resistance is near the $1,665 level. An upside break above the $1,665 resistance zone could start a fresh rally. In the stated case, the price may perhaps rise towards the $1,720 resistance. Any more gains might send the price towards $1,800 or even $1,850 in the near term.
Dips Supported in ETH?If ethereum fails to clear the $1,640 resistance, it could start another downside correction. An initial support on the downside is near the $1,620 level and the 100 hourly SMA.
The next major support is near the $1,580 level or the 50% Fib retracement level of the upward wave from the $1,481 swing low to $1,680 high. If there is a break below $1,580, the price might drop towards the $1,520 support. Any more losses might call for a test of the $1,500 zone.
Technical Indicators
Hourly MACD – The MACD for ETH/USD is now gaining momentum in the bullish zone.
Hourly RSI – The RSI for ETH/USD is now above the 50 level.
Major Support Level – $1,580
Major Resistance Level – $1,640
Original source
Read on NewsBTCRelated market context

Standard Chartered Says Bitcoin Bottomed Near $59,000 As Crypto Winter Ends
TL;DR Standard Chartered’s Geoffrey Kendrick reportedly says Bitcoin’s $59,000 area marked the cycle bottom. The note cites SpaceX...

XRP Price Prediction: Japan XRP ETF Listing is Getting Closer
Japan just handed XRP bulls a major regulatory tailwind. XRP price is retesting a congestion zone, and the prediction could turn b...

Elon Musk SpaceX AI Predicts Incredible Bitcoin Price For Next 30 Days
Here is the thing about capitulation calls. They only sound smart in hindsight. Right now, with Bitcoin price scraping along the l...

Michael Saylor says investor confidence in Ethereum has collapsed
Ethereum's declining investor confidence signals a shift towards Bitcoin dominance, emphasizing real-world utility over speculativ...

Bitcoin Mining Cost Model Points To $47,000 Floor, But Analysts Urge Caution
TL;DR Crypto Rover says Bitcoin has never bottomed below electrical production cost, currently estimated at $47,000. Mining-cost m...

Blackrock’s IBIT Leads $86 Million Bitcoin ETF Inflow as Ethereum Funds Extend Outflow Streak
Spot bitcoin exchange-traded funds (ETFs) drew $85.85 million in net inflows on Friday, with every one of the 12 tracked funds avo...