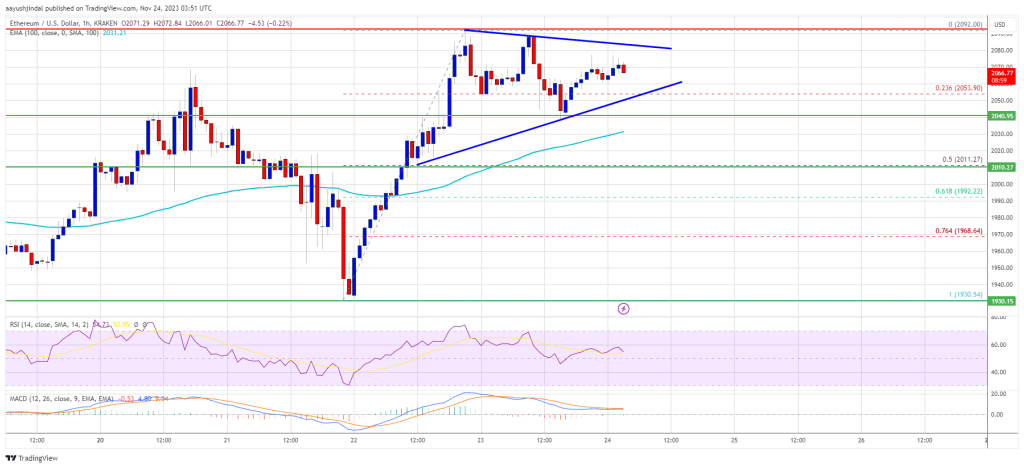
Ethereum Price Forms Bullish Pattern, Why ETH Could Extend Its Rally
Ethereum price surged above $2,050. ETH is now consolidating gains and might soon aim for another rally toward the $2,150 level. Ethereum is consolidating and facing resistance near the $2,080 zone. The price is trading...

Ethereum price surged above $2,050. ETH is now consolidating gains and might soon aim for another rally toward the $2,150 level.
- Ethereum is consolidating and facing resistance near the $2,080 zone.
- The price is trading above $2,030 and the 100-hourly Simple Moving Average.
- There is a short-term contracting triangle forming with resistance near $2,080 on the hourly chart of ETH/USD (data feed via Kraken).
- The pair could extend its rally if it clears the $2,080 and $2,090 resistance levels.
Ethereum price started a strong increase above the $2,000 resistance zone. ETH outperformed Bitcoin yesterday with a move above the $2,050 resistance zone. However, the bulls faced hurdles near the $2,080 and $2,090 levels.
A high was formed near $2,092 and the price is now consolidating gains. There was a small correction below the $2,060 level. The price dipped below the 23.6% Fib retracement level of the upward wave from the $1,930 swing low to the $2,092 high.
Ethereum is still well above $2,030 and the 100-hourly Simple Moving Average. On the upside, the price is facing resistance near the $2,080 zone. There is also a short-term contracting triangle forming with resistance near $2,080 on the hourly chart of ETH/USD.
Source: ETHUSD on TradingView.com
The first key resistance is near the $2,090 level. A clear move above the $2,090 level could send the price toward the $2,150 resistance zone. The next resistance is near $2,200, above which the price could aim for a move toward the $2,250 level. Any more gains could start a wave toward the $2,320 level.
Another Drop in ETH?If Ethereum fails to clear the $2,080 resistance, it could start a fresh decline. Initial support on the downside is near the $2,055 level and the triangle trend line.
The next key support is $2,010 or the 50% Fib retracement level of the upward wave from the $1,930 swing low to the $2,092 high. The key support is now at $1,975. A downside break below the $1,975 support might trigger more losses. In the stated case, Ether could drop toward the $1,930 support zone in the near term.
Technical Indicators
Hourly MACD – The MACD for ETH/USD is losing momentum in the bullish zone.
Hourly RSI – The RSI for ETH/USD is now above the 50 level.
Major Support Level – $2,055
Major Resistance Level – $2,080
Original source
Read on NewsBTCRelated market context

Uranium Holds Above $85 as Mining ETF Rebounds From June Sell-Off
The latest charts display that the market is divided into stable physical prices and uranium shares trying to regain momentum afte...

Standard Chartered Says Bitcoin Bottomed Near $59,000 As Crypto Winter Ends
TL;DR Standard Chartered’s Geoffrey Kendrick reportedly says Bitcoin’s $59,000 area marked the cycle bottom. The note cites SpaceX...

Elon Musk’s trillionaire status puts his net worth above crypto’s entire market cap outside Bitcoin
Elon Musk has become the first person in modern history to amass a personal net worth exceeding $1 trillion, crossing the historic...

Tether USDT Briefly Overtakes Ethereum in Market Cap: A $187B Wake-Up Call
For a few hours, earlier this week, Tether USDT stablecoin held a higher market cap than Ethereum, the first time that has happene...

Google Gemini AI Predicts Jaw-Dropping XRP Price For Next 90 Days
Google Gemini AI just put XRP back under the spotlight, predicting it is tightly wound for a major breakout toward $1.60 to $1.80...

Elon Musk SpaceX AI Predicts Incredible Bitcoin Price For Next 30 Days
Here is the thing about capitulation calls. They only sound smart in hindsight. Right now, with Bitcoin price scraping along the l...