Ethereum price gained 90% the last time this indicator turned bullish
Key Takeaways:Ethereum is forming a bull flag on the daily chart, with a potential breakout above $3,600.If ETH reclaims the 2-week Gaussian Channel mid-line, a 90% rally could occur.Ether (ETH) price is consolidating be...
Archive context
Older archive item. Useful for background and entity history, but not a fresh market-moving signal.

Key Takeaways:
Ethereum is forming a bull flag on the daily chart, with a potential breakout above $3,600.
If ETH reclaims the 2-week Gaussian Channel mid-line, a 90% rally could occur.
Ether (ETH) price is consolidating between $2,400 and $2,750 on its daily chart, forming a bull flag pattern with sights on the $3,000 to $3,100 resistance zone. A bull flag is a continuation pattern that follows a sharp rally (black flagpole) to $2,730 from $1,900, with the current range forming the flag.
Ethereum 1-day chart. Source: Cointelegraph/TradingViewA bullish breakout above $2,600 could target $3,600, which is calculated by adding the flagpole height to the breakout point, but the immediate key area of interest remains between the resistance range at $3,100-$3,000.
The 200-day exponential moving average (EMA) supports the lower range. The relative strength index (RSI), although still near the overbought region, has significantly cooled over the past few days.
An ETH breakout with rising RSI and volume could confirm the bullish move, while a drop below $2,400 risks invalidating the pattern.
Can Ether reclaim the Gaussian Channel midline?On May 20, Ether showed a significant trend shift as it attempted to reclaim the midline of the two-week Gaussian Channel, a technical indicator used to identify price trends. The Gaussian or Normal Distribution Channel plots price movements within a dynamic range, adapting to market volatility.
Historically, when ETH crosses above this midline, significant rallies often follow. In 2023, ETH surged 93% to $4,000 after a similar crossover, while in 2020, it skyrocketed by 1,820%, sparking a massive altcoin rally.
Ethereum Gaussian channel analysis. Source: Cointelegraph/TradingViewConversely, a similar setup in August 2022 led to an invalidation during a market correction, highlighting the risks of relying solely on this indicator.
Likewise, crypto trader Merlijn noted a golden cross between the 50-day SMA and 200-day SMA (simple moving average), which could further strengthen an imminent ETH breakout. It is important to note that the golden cross is on a 12-hour chart, which is less dependable than the one-day chart.
Related: Bitcoin fractal analysis forecasts new all-time highs above $110K by end of week
Traders exercise caution ahead of possible “range-bound environment”Popular crypto trader XO noted that Ethereum is consolidating under a “decent” resistance level below the $2,800 mark. The trader expects a correction if ETH cannot break above $2,800 over the next few days. The analyst said,
“I am leaning toward price carving out a range bound environment for at least several weeks potentially longer, and once again becoming a buyer.”A contrarian outlook to bulls can also be observed with ETH prices oscillating under the Fibonacci levels. Cointelegraph reported that Ether recently retested the 0.5 to 0.618 Fib levels, which could trigger a short-term correction for ETH.
In such a scenario, the immediate area of support remains around $2,150 and $1,900, possibly slowing down the bullish momentum for a prolonged period.
Ethereum 1-week price analysis. Source: Cointelegraph/TradingViewRelated: Why is Ethereum (ETH) price up today?
This article does not contain investment advice or recommendations. Every investment and trading move involves risk, and readers should conduct their own research when making a decision.
Why this matters
This ethereum story adds another data point to the current market tape and is useful when read alongside nearby source coverage.
Original source
Read on CointelegraphRelated market context

ETH USD Loses Ground as Ethereum Price Analysis Remains Targeting $3,000 This Week
Ethereum Price Prediction, September 23: Ethereum (ETH) trades at $2,735, down a marginal 0.61% over the past 24 hours, a pause, n...

Ethereum ETFs Pull In $270M As BlackRock Leads September 21 Rebound
TL;DR US spot Ethereum ETFs recorded $270.0 million of net inflows for the September 21 session. BlackRock’s ETHA led the day with...

Solana flips Ethereum in fees, while ETH holds the burn lead
Solana generated more user fees than Ethereum in data provider DefiLlama's Sept. 22 dashboard snapshot, while Ethereum burned more...
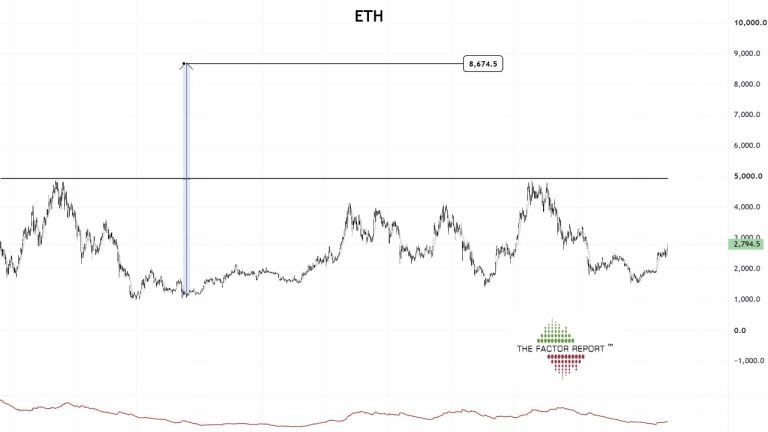
Peter Brandt Sees Ethereum at $8,600 if ETH Clears $5,000
Ethereum could eventually reach $8,600 if it first clears $5,000, according to a long-term chart posted by veteran trader Peter Br...

Cloudflare’s Will Papper suggests Ethereum’s sharding design could enable scalable stablecoin payments
Cloudflare's adoption of Ethereum's sharding design for scalable stablecoin payments could revolutionize machine-to-machine transa...

Bitcoin and Ethereum ETFs pull in $877M in a single day as institutional appetite surges
The surge in institutional investments in crypto ETFs signals growing mainstream acceptance and could drive further market stabili...