Ethereum Price Hesitates But This Trend Line Might Trigger Fresh Increase
Ethereum price extended its decline below $1,950 against the US Dollar. ETH could start a fresh increase if it clears the $1,960 and $2,000 resistance levels. Ethereum traded further lower below the $1,950 support. The p...

Ethereum price extended its decline below $1,950 against the US Dollar. ETH could start a fresh increase if it clears the $1,960 and $2,000 resistance levels.
- Ethereum traded further lower below the $1,950 support.
- The price is trading below $1,960 and the 100-hourly Simple Moving Average.
- There is a key bearish trend line forming with resistance near $1,950 on the hourly chart of ETH/USD (data feed via Kraken).
- The pair could start a decent increase if it clears the $1,950 and $1,960 levels.
Ethereum’s price started a fresh decline from the $2,125 resistance zone. ETH gained bearish momentum after it broke the $2,000 support, similar to Bitcoin.
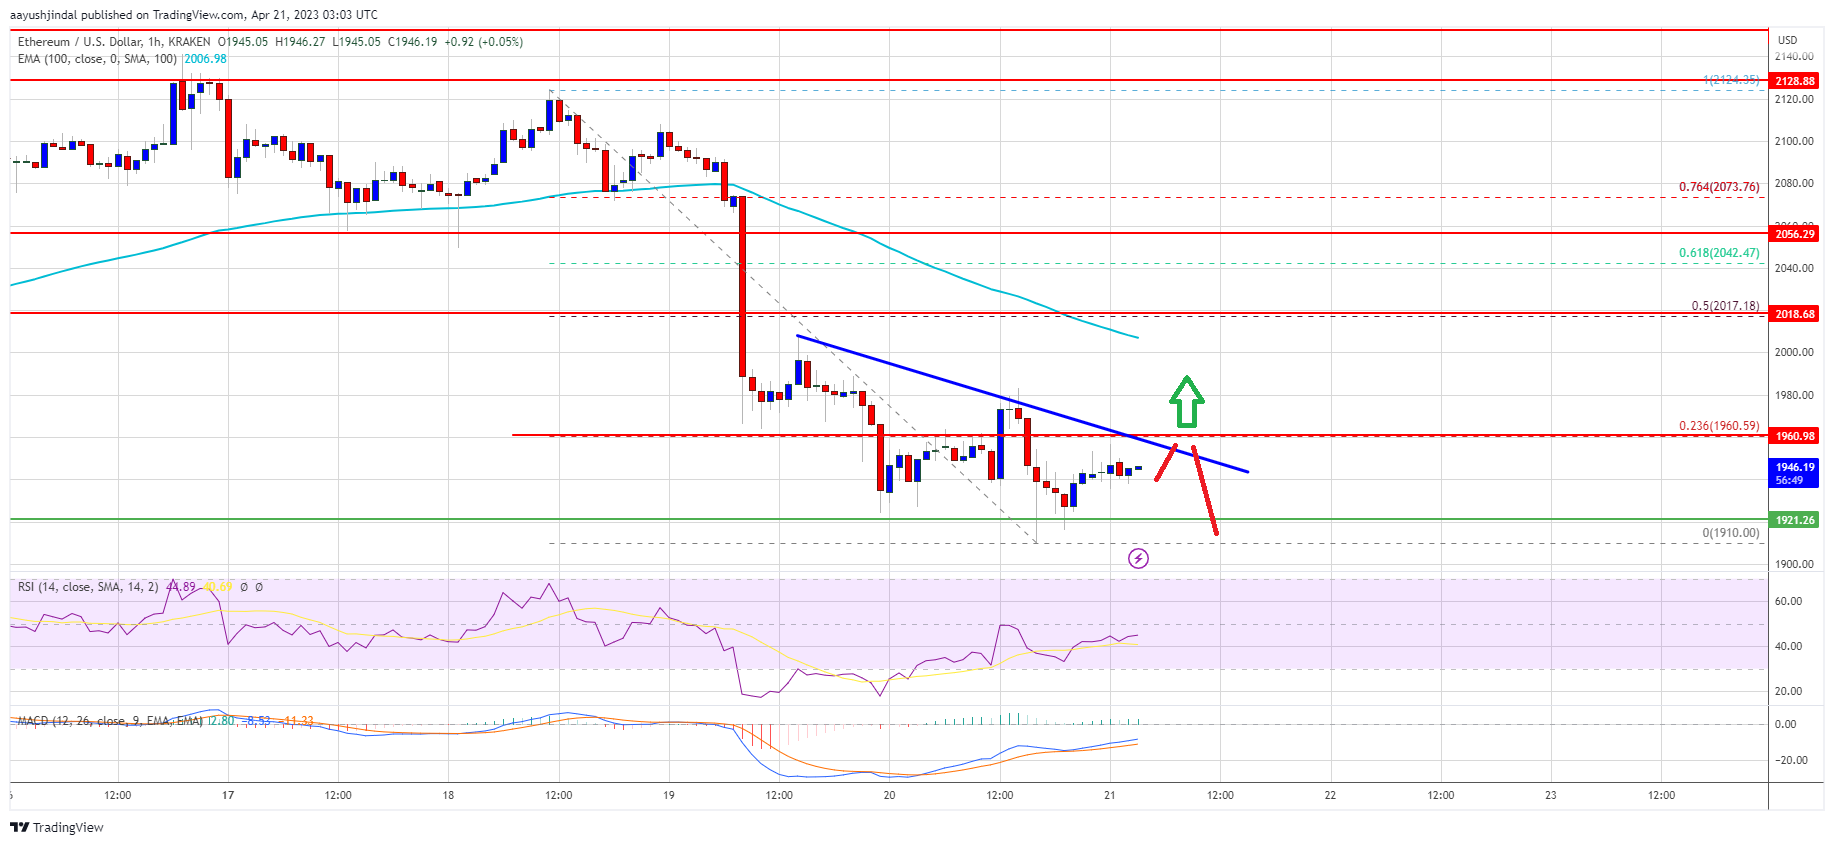
The bears even pushed the price below the $1,950 support. A low is formed near $1,910 and the price is now consolidating losses. Ether is now trading below $1,960 and the 100-hourly Simple Moving Average. Immediate resistance is near the $1,950 zone.
There is also a key bearish trend line forming with resistance near $1,950 on the hourly chart of ETH/USD. The 23.6% Fib retracement level of the key decline from the $2,124 swing high to the $1,910 low is also just above the trend line.
An upside break above the trend line resistance and then $1,960 might send Ethereum toward $2,000. The next major resistance is near the $2,020 zone or the 50% Fib retracement level of the key decline from the $2,124 swing high to the $1,910 low. A close above the $2,020 resistance zone could start a fresh increase.
Source: ETHUSD on TradingView.com
In the stated case, the price could rise toward the $2,080 resistance. Any more gains could send Ether toward the $2,125 resistance in the near term.
More Losses in ETH?If Ethereum fails to clear the $1,95s0 resistance, it could continue to move down. Initial support on the downside is near the $1,920 level or the recent low.
The next major support is near the $1,900 zone, below which ether price might gain bearish momentum. In the stated case, the price might decline toward $1,860. Any more losses may perhaps send the price toward $1,820 in the coming days.
Technical Indicators
Hourly MACD – The MACD for ETH/USD is now losing momentum in the bearish zone.
Hourly RSI – The RSI for ETH/USD is below the 50 level.
Major Support Level – $1,920
Major Resistance Level – $1,960
Original source
Read on NewsBTCRelated market context

Standard Chartered Says Bitcoin Bottomed Near $59,000 As Crypto Winter Ends
TL;DR Standard Chartered’s Geoffrey Kendrick reportedly says Bitcoin’s $59,000 area marked the cycle bottom. The note cites SpaceX...

XRP aims for $0.90 as ETF demand battles selling pressure from whales
XRP is trading at $1.11, down roughly 17% from its June opening, having set a new 2026 low on June 5 and shed $8 billion in market...

Google Gemini AI Predicts Jaw-Dropping XRP Price For Next 90 Days
Google Gemini AI just put XRP back under the spotlight, predicting it is tightly wound for a major breakout toward $1.60 to $1.80...

US forces shoot down Iranian attack drones near Strait of Hormuz, Bitcoin drops below $73K
Geopolitical tensions near vital oil routes can destabilize financial markets, highlighting the interconnectedness of global secur...

Bitcoin price challenges $64,000 weekend wall – needing a breakout or risk a deeper correction
Bitcoin reclaimed $64,000 on June 12 and touched an intraday high of $64,301 in the same session that spot ETF flows finally flipp...

Elon Musk SpaceX AI Predicts Incredible Bitcoin Price For Next 30 Days
Here is the thing about capitulation calls. They only sound smart in hindsight. Right now, with Bitcoin price scraping along the l...