Ethereum Price Hints At Potential Correction But Faces Uphill Task
Ethereum price is attempting a recovery wave from $1,565 against the US Dollar. ETH could struggle to recover above $1,600 and might resume its decline. Ethereum is slowly moving higher toward the $1,600 resistance zone....

Ethereum price is attempting a recovery wave from $1,565 against the US Dollar. ETH could struggle to recover above $1,600 and might resume its decline.
- Ethereum is slowly moving higher toward the $1,600 resistance zone.
- The price is trading below $1,600 and the 100-hourly Simple Moving Average.
- There is a major bearish trend line forming with resistance near $1,595 on the hourly chart of ETH/USD (data feed via Kraken).
- The pair could start a fresh decline if it fails to clear the $1,600 resistance zone.
Ethereum’s price started a fresh decline below the $1,620 and $1,600 levels. ETH even declined to a new weekly low below the $1,580 level, unlike Bitcoin.
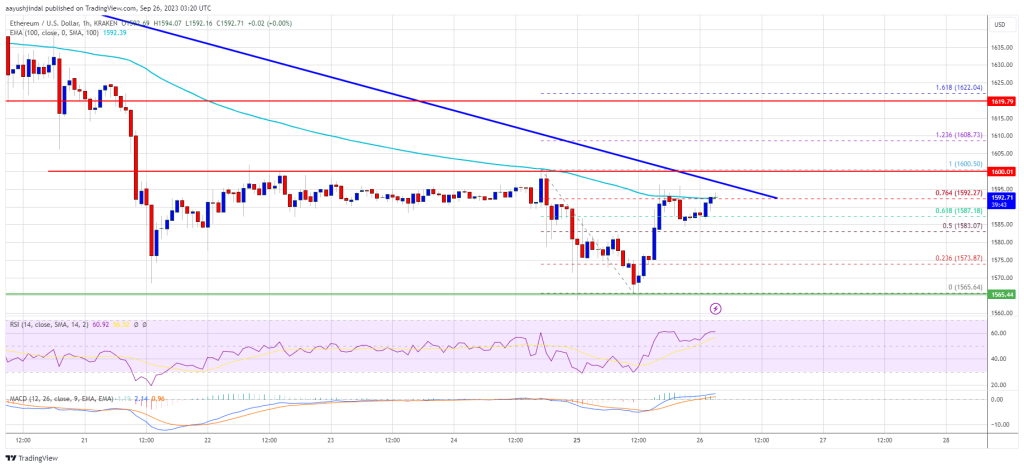
It traded as low as $1,565 and recently started a short-term upside correction. There was a move above the $1,580 level. The price climbed above the 50% Fib retracement level of the recent drop from the $1,600 swing high to the $1,565 low.
However, the bears are still active near the $1,600 resistance. The price is struggling to clear the 76.4% Fib retracement level of the recent drop from the $1,600 swing high to the $1,565 low.
Ether is now trading below $1,600 and the 100-hourly Simple Moving Average. There is also a major bearish trend line forming with resistance near $1,595 on the hourly chart of ETH/USD. On the upside, the price might face resistance near the $1,595 level.
Source: ETHUSD on TradingView.com
The next major resistance is $1,600. A push above $1,600 might send Ethereum toward $1,620. If the bulls succeed in clearing the $1,620 hurdle, the price could start a decent increase toward the $1,650 resistance. Any more gains might open the doors for a move toward $1,700.
More Losses in ETH?If Ethereum fails to clear the $1,600 resistance, it could start another decline. Initial support on the downside is near the $1,580 level.
The next key support is $1,565, below which the price could test the $1,540 support. A downside break below $1,540 might push the price further into a bearish zone. In the stated case, there could be a drop toward the $1,500 level.
Technical Indicators
Hourly MACD – The MACD for ETH/USD is losing momentum in the bearish zone.
Hourly RSI – The RSI for ETH/USD is now above the 50 level.
Major Support Level – $1,565
Major Resistance Level – $1,600
Original source
Read on NewsBTCRelated market context

Uranium Holds Above $85 as Mining ETF Rebounds From June Sell-Off
The latest charts display that the market is divided into stable physical prices and uranium shares trying to regain momentum afte...

Elon Musk’s trillionaire status puts his net worth above crypto’s entire market cap outside Bitcoin
Elon Musk has become the first person in modern history to amass a personal net worth exceeding $1 trillion, crossing the historic...

Bitcoin price challenges $64,000 weekend wall – needing a breakout or risk a deeper correction
Bitcoin reclaimed $64,000 on June 12 and touched an intraday high of $64,301 in the same session that spot ETF flows finally flipp...

Elon Musk SpaceX AI Predicts Incredible Bitcoin Price For Next 30 Days
Here is the thing about capitulation calls. They only sound smart in hindsight. Right now, with Bitcoin price scraping along the l...

Standard Chartered Says Bitcoin Bottomed Near $59,000 As Crypto Winter Ends
TL;DR Standard Chartered’s Geoffrey Kendrick reportedly says Bitcoin’s $59,000 area marked the cycle bottom. The note cites SpaceX...

US forces shoot down Iranian attack drones near Strait of Hormuz, Bitcoin drops below $73K
Geopolitical tensions near vital oil routes can destabilize financial markets, highlighting the interconnectedness of global secur...