Ethereum Price Hints At Potential Correction, Buy The Dip?
Ethereum failed again to settle above the $1,300 resistance against the US Dollar. ETH is moving lower and might soon test the $1,220 support zone. Ethereum attempted another upside break above $1,300, but failed. The pr...

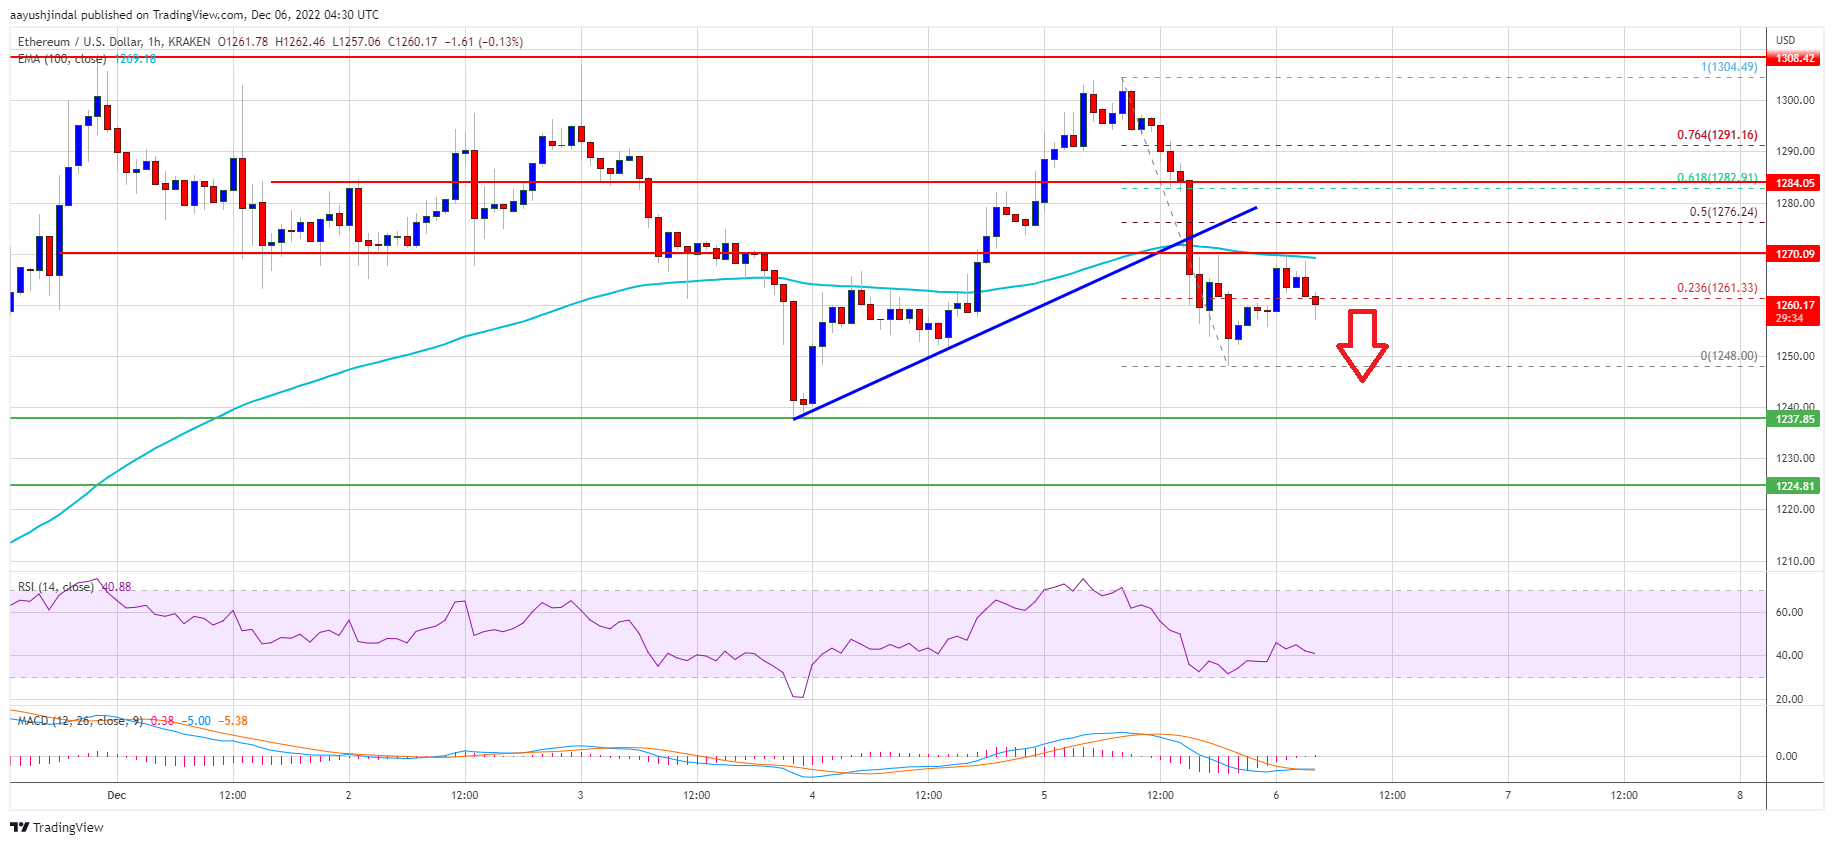
Ethereum failed again to settle above the $1,300 resistance against the US Dollar. ETH is moving lower and might soon test the $1,220 support zone.
- Ethereum attempted another upside break above $1,300, but failed.
- The price is now trading below $1,280 and the 100 hourly simple moving average.
- There was a break below a key bullish trend line with support near $1,272 on the hourly chart of ETH/USD (data feed via Kraken).
- The pair could correct further lower, but the $1,220 support is the key.
Ethereum price made another attempt to surpass the $1,300 resistance zone. However, ETH struggled to gain momentum above the $1,300 level. A high was formed near $1,304 and the price started a downside correction, similar to bitcoin.
The price declined below the $1,280 support zone and the 100 hourly simple moving average. Besides, there was a break below a key bullish trend line with support near $1,272 on the hourly chart of ETH/USD.
Ether price traded as low as $1,248 and is currently consolidating losses. There was a minor increase above the $1,260 level. The price climbed above the 23.6% Fib retracement level of the recent decline from the $1,304 swing high to $1,248 low.
An immediate resistance on the upside is near the $1,270 level and the 100 hourly simple moving average. The first major resistance is near the $1,275 level. It is near the 50% Fib retracement level of the recent decline from the $1,304 swing high to $1,248 low.
Source: ETHUSD on TradingView.com
A close above the $1,275 resistance might send the price further higher. The next major resistance is near the $1,300 level, above which ether price might test $1,320. Any more gains might send the price towards the $1,400 resistance zone.
Retest of a Key Support by ETH?If ethereum fails to start another increase above the $1,275 resistance, it could continue to move down. An initial support on the downside is near the $1,250 level.
The next major support is near the $1,220 level. If there is a break below $1,220, the price could test the $1,165 support. Any more losses could lead the price towards the $1,100 support.
Technical Indicators
Hourly MACD – The MACD for ETH/USD is now gaining momentum in the bearish zone.
Hourly RSI – The RSI for ETH/USD is now below the 50 level.
Major Support Level – $1,220
Major Resistance Level – $1,275
Featured image from iStockOriginal source
Read on NewsBTCRelated market context

Uranium Holds Above $85 as Mining ETF Rebounds From June Sell-Off
The latest charts display that the market is divided into stable physical prices and uranium shares trying to regain momentum afte...

Standard Chartered Says Bitcoin Bottomed Near $59,000 As Crypto Winter Ends
TL;DR Standard Chartered’s Geoffrey Kendrick reportedly says Bitcoin’s $59,000 area marked the cycle bottom. The note cites SpaceX...

Bitcoin price challenges $64,000 weekend wall – needing a breakout or risk a deeper correction
Bitcoin reclaimed $64,000 on June 12 and touched an intraday high of $64,301 in the same session that spot ETF flows finally flipp...

Bitcoin rises above $64,000 after Pakistan prime minister says Iran peace deal is near
Bitcoin traded above $64,000 on Saturday, supported by its strongest ETF inflows in a month and growing optimism around geopolitic...

US forces shoot down Iranian attack drones near Strait of Hormuz, Bitcoin drops below $73K
Geopolitical tensions near vital oil routes can destabilize financial markets, highlighting the interconnectedness of global secur...

Elon Musk’s trillionaire status puts his net worth above crypto’s entire market cap outside Bitcoin
Elon Musk has become the first person in modern history to amass a personal net worth exceeding $1 trillion, crossing the historic...