Ethereum Price Hints At Potential Rally But This Resistance Is The Key
Ethereum started another increase above the $1,620 resistance against the US Dollar. ETH is rising and might rally if it clears the $1,665 resistance zone. Ethereum is slowly moving higher above the $1,600 and $1,620 lev...

Ethereum started another increase above the $1,620 resistance against the US Dollar. ETH is rising and might rally if it clears the $1,665 resistance zone.
- Ethereum is slowly moving higher above the $1,600 and $1,620 levels.
- The price is now trading above $1,620 and the 100 hourly simple moving average.
- There was a break above a major bearish trend line with resistance near $1,615 on the hourly chart of ETH/USD (data feed via Kraken).
- The pair could rally if there is a clear move above the $1,665 resistance zone.
Ethereum price remained well bid above the $1,550 level. ETH formed a base and started a fresh increase above the $1,600 resistance zone. There was a clear move above the $1,620 resistance, similar to bitcoin.
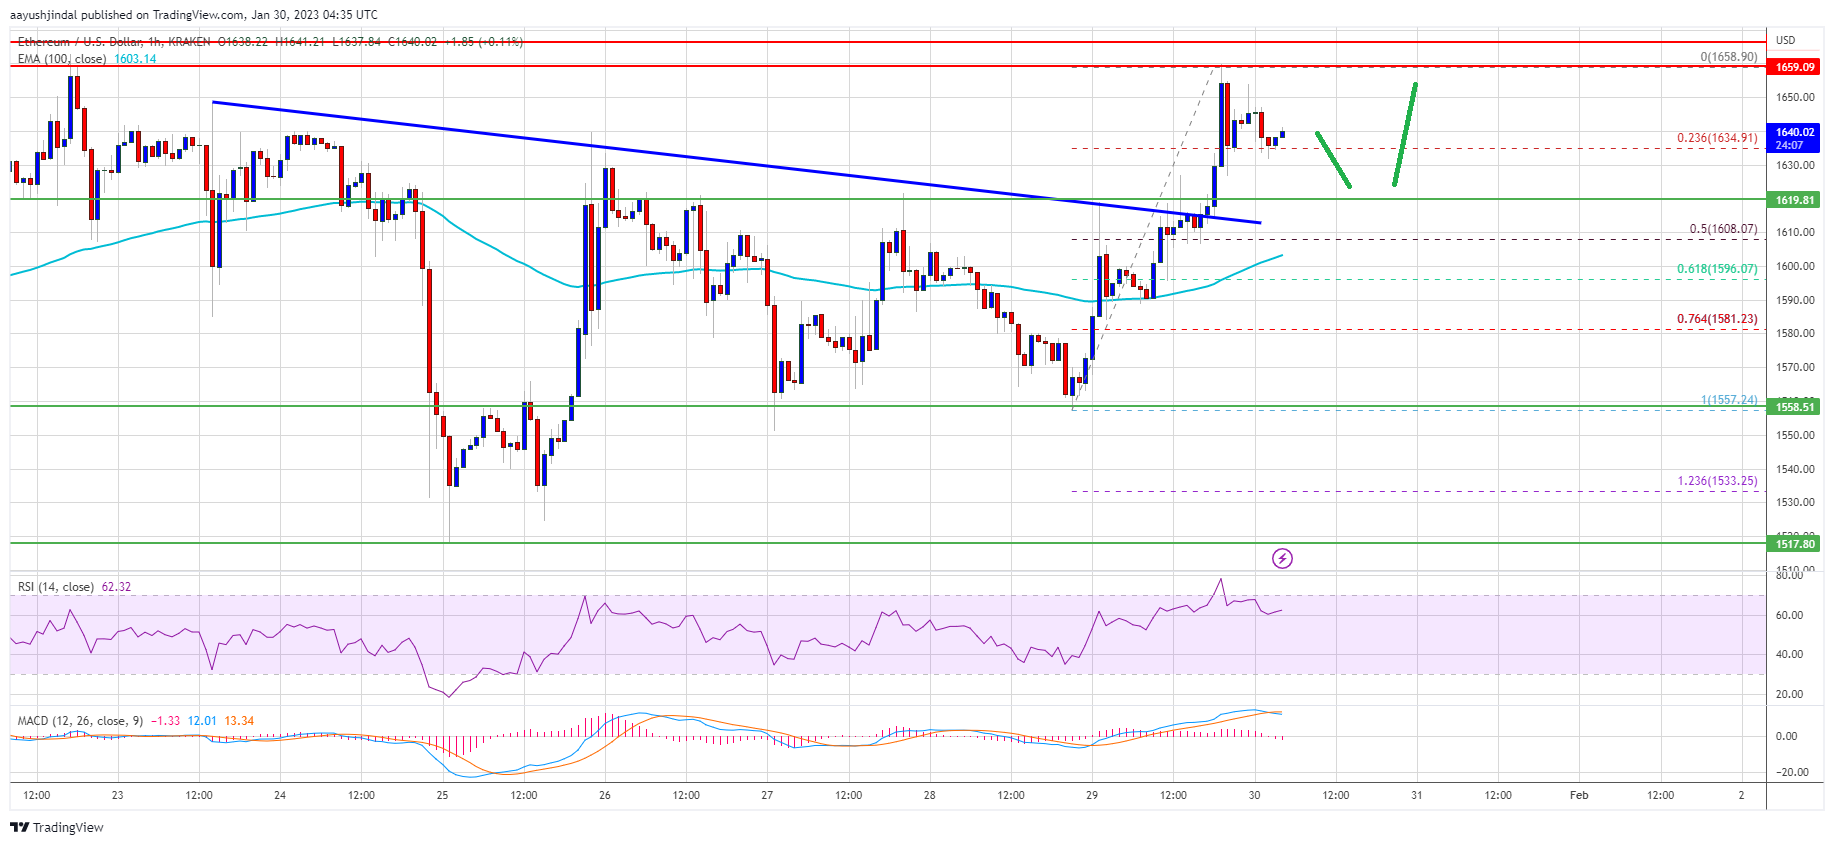
There was a break above a major bearish trend line with resistance near $1,615 on the hourly chart of ETH/USD. The bulls were able to pump the price above the $1,640 resistance. A high is formed near $1,658 and the price is now consolidating gains.
Ether price is now trading above $1,620 and the 100 hourly simple moving average. It is trading near the 23.6% Fib retracement level of the upward move from the $1,557 swing low to $1,658 high.
Source: ETHUSD on TradingView.com
An immediate resistance is near the $1,655 level. The next major resistance is near the $1,665 level. An upside break above the $1,665 resistance zone could start a decent increase. In the stated case, the price may perhaps rise towards the $1,720 resistance. Any more gains might send ether towards the $1,800 level.
Dips Limitd in ETH?If ethereum fails to clear the $1,665 resistance, it could start a downside correction. An initial support on the downside is near the $1,620 level or the broken trend line.
The next major support is near the $1,600 level or the 50% Fib retracement level of the upward move from the $1,557 swing low to $1,658 high. If there is a break below $1,600, the price might drop towards the $1,550 support. Any more losses might call for a retest of the $1,520 zone in the near term.
Technical Indicators
Hourly MACD – The MACD for ETH/USD is now gaining momentum in the bullish zone.
Hourly RSI – The RSI for ETH/USD is now above the 50 level.
Major Support Level – $1,620
Major Resistance Level – $1,665
Original source
Read on NewsBTCRelated market context

Uranium Holds Above $85 as Mining ETF Rebounds From June Sell-Off
The latest charts display that the market is divided into stable physical prices and uranium shares trying to regain momentum afte...

Tether USDT Briefly Overtakes Ethereum in Market Cap: A $187B Wake-Up Call
For a few hours, earlier this week, Tether USDT stablecoin held a higher market cap than Ethereum, the first time that has happene...

Bitcoin price challenges $64,000 weekend wall – needing a breakout or risk a deeper correction
Bitcoin reclaimed $64,000 on June 12 and touched an intraday high of $64,301 in the same session that spot ETF flows finally flipp...

Elon Musk SpaceX AI Predicts Incredible Bitcoin Price For Next 30 Days
Here is the thing about capitulation calls. They only sound smart in hindsight. Right now, with Bitcoin price scraping along the l...

Standard Chartered Says Bitcoin Bottomed Near $59,000 As Crypto Winter Ends
TL;DR Standard Chartered’s Geoffrey Kendrick reportedly says Bitcoin’s $59,000 area marked the cycle bottom. The note cites SpaceX...

Elon Musk’s trillionaire status puts his net worth above crypto’s entire market cap outside Bitcoin
Elon Musk has become the first person in modern history to amass a personal net worth exceeding $1 trillion, crossing the historic...