Ethereum Price Hints at Recovery: Is a Comeback in Sight?
Ethereum price tested the $2,400 zone and recovered some losses. ETH must clear the $2,550 resistance zone to start a decent increase in the near term. Ethereum started a consolidation phase after a sharp decline to $2,4...

Ethereum price tested the $2,400 zone and recovered some losses. ETH must clear the $2,550 resistance zone to start a decent increase in the near term.
- Ethereum started a consolidation phase after a sharp decline to $2,400.
- The price is trading below $2,550 and the 100-hourly Simple Moving Average.
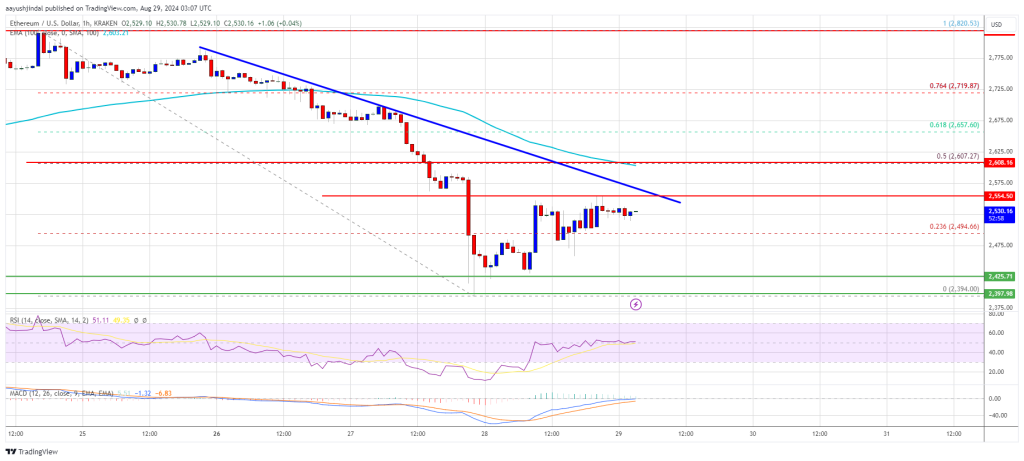
- There is a key bearish trend line forming with resistance at $2,555 on the hourly chart of ETH/USD (data feed via Kraken).
- The pair could start a recovery wave if it clears the $2,555 and $2,600 resistance levels.
Ethereum price extended its decline below the $2,650 level. ETH even traded below the $2,550 and $2,500 support levels like Bitcoin. Finally, the bulls appeared near the $2,400 zone.
A low was formed at $2,394 and the price recently started a minor recovery wave. There was a move above the $2,450 and $2,480 levels. It broke the 23.6% Fib retracement level of the downward wave from the $2,820 swing high to the $2,394 low.
Ethereum price is now trading below $2,550 and the 100-hourly Simple Moving Average. On the upside, the price seems to be facing hurdles near the $2,550 level. There is also a key bearish trend line forming with resistance at $2,555 on the hourly chart of ETH/USD.
The first major resistance is near the $2,600 level. It is near the 50% Fib retracement level of the downward wave from the $2,820 swing high to the $2,394 low. A close above the $2,600 level might send Ether toward the $2,665 resistance.
The next key resistance is near $2,720. An upside break above the $2,720 resistance might send the price higher toward the $2,820 resistance zone in the near term.
Another Decline In ETH?If Ethereum fails to clear the $2,555 resistance, it could start another decline. Initial support on the downside is near $2,480. The first major support sits near the $2,450 zone.
A clear move below the $2,450 support might push the price toward $2,425 where the bulls could emerge. Any more losses might send the price toward the $2,320 support level in the near term. The next key support sits at $2,250.
Technical Indicators
Hourly MACD – The MACD for ETH/USD is losing momentum in the bearish zone.
Hourly RSI – The RSI for ETH/USD is now above the 50 zone.
Major Support Level – $2,450
Major Resistance Level – $2,550
Original source
Read on NewsBTCRelated market context

Uranium Holds Above $85 as Mining ETF Rebounds From June Sell-Off
The latest charts display that the market is divided into stable physical prices and uranium shares trying to regain momentum afte...

Standard Chartered Says Bitcoin Bottomed Near $59,000 As Crypto Winter Ends
TL;DR Standard Chartered’s Geoffrey Kendrick reportedly says Bitcoin’s $59,000 area marked the cycle bottom. The note cites SpaceX...

Elon Musk’s trillionaire status puts his net worth above crypto’s entire market cap outside Bitcoin
Elon Musk has become the first person in modern history to amass a personal net worth exceeding $1 trillion, crossing the historic...

Bitcoin rises above $64,000 after Pakistan prime minister says Iran peace deal is near
Bitcoin traded above $64,000 on Saturday, supported by its strongest ETF inflows in a month and growing optimism around geopolitic...

US forces shoot down Iranian attack drones near Strait of Hormuz, Bitcoin drops below $73K
Geopolitical tensions near vital oil routes can destabilize financial markets, highlighting the interconnectedness of global secur...

BTC Momentum Turns Positive as Bitcoin Fights to Hold the $64,000 Zone
Bitcoin ( BTC) is trading at $64,549 per coin on June 14, 2026, at 8 a.m. Eastern time, holding above a critical demand zone while...