Ethereum Price Hits $3K But The Bulls Are Not Done Yet
Ethereum price climbed further higher and broke the $3,000 resistance. ETH is still showing positive signs and might extend gains toward $3,120. Ethereum extended its rally above the $2,980 and $3,000 levels. The price i...

Ethereum price climbed further higher and broke the $3,000 resistance. ETH is still showing positive signs and might extend gains toward $3,120.
- Ethereum extended its rally above the $2,980 and $3,000 levels.
- The price is trading above $3,000 and the 100-hourly Simple Moving Average.
- There is a key bullish trend line forming with support at $2,950 on the hourly chart of ETH/USD (data feed via Kraken).
- The pair could continue to move up toward the $3,120 resistance zone.
Ethereum price formed a base above the $2,850 level and started another increase. ETH cleared the $2,920 resistance zone and outperformed Bitcoin. Finally, the price climbed above the $3,000 barrier.
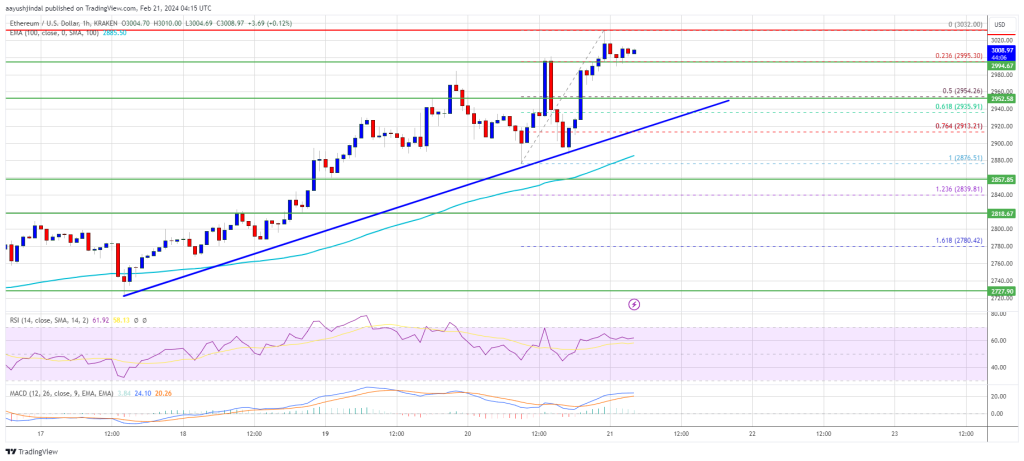
A new multi-week high is formed near $3,032 and the price is now consolidating gains. Ether is stable near the 23.6% Fib retracement level of the recent increase from the $2,876 swing low to the $3,032 high. There is also a key bullish trend line forming with support at $2,950 on the hourly chart of ETH/USD.
Ethereum is now trading above $3,000 and the 100-hourly Simple Moving Average. Immediate resistance on the upside is near the $3,040 level. The first major resistance is near the $3,065 level. The next major resistance is near $3,120, above which the price might rise and test the $3,220 resistance zone.
Source: ETHUSD on TradingView.com
If there is a move above the $3,220 resistance, Ether could even rally toward the $3,350 resistance. Any more gains might call for a test of $3,500.
Downside Correction In ETH?If Ethereum fails to clear the $3,040 resistance, it could start a downside correction. Initial support on the downside is near the $2,995 level.
The first major support is near the $2,950 level and the trend line zone. It is close to the 50% Fib retracement level of the recent increase from the $2,876 swing low to the $3,032 high. The next key support could be the $2,910 zone. A clear move below the $2,910 support might send the price toward $2,880 or the 100-hourly Simple Moving Average. The main support could be $2,850. Any more losses might send the price toward the $2,720 level in the coming sessions.
Technical Indicators
Hourly MACD – The MACD for ETH/USD is gaining momentum in the bullish zone.
Hourly RSI – The RSI for ETH/USD is now above the 50 level.
Major Support Level – $2,950
Major Resistance Level – $3,040
Original source
Read on NewsBTCRelated market context

BTC News Today: Bitcoin Climbs Toward $66K as Trump Reveals US-Iran Peace Deal
The renewed geopolitical optimism helped improve risk sentiment across financial markets, pushing Bitcoin back toward the $66,000...

Bitcoin Stabilizes Near Key Zone, But Glassnode Warns Capital Flows Remain Weak
Bitcoin’s rebound from the $60,000 area has given bulls something to work with, but Glassnode’s latest market read suggests the re...

Lummis Links Bitcoin to $39.2T US Debt Crisis as CLARITY Act Nears Senate Floor
Senator Cynthia Lummis publicly tied Bitcoin to America’s $39.2 trillion national debt crisis on June 15, positioning the asset as...

XRP Price Prediction: US-Iran Peace Deal Fuels 13% XRP Surge, Analysts Target $1.94 Retest
The latest move saw XRP price today reclaim the $1.28 level for the first time in nearly two weeks. Market participants pointed to...

Bitcoin’s Iran rally faces Japan rate test as it weighs 31-year high
Bitcoin's current relief rally is built on the back of the framework agreement between the US and Iran to halt their conflict and...

Emerging-market stocks near record high as tech gains boost rally, leaving crypto behind
The tech-driven rally in emerging markets highlights a shift in capital allocation, potentially sidelining crypto as investors cha...