Ethereum Price Holds 100 SMA But Needs To Clear This For More Gains
Ethereum price is consolidating above $2,250. ETH could start a fresh increase if there is a clear move above the $2,320 resistance zone. Ethereum started a fresh increase above the $2,200 and $2,220 levels. The price is...

Ethereum price is consolidating above $2,250. ETH could start a fresh increase if there is a clear move above the $2,320 resistance zone.
- Ethereum started a fresh increase above the $2,200 and $2,220 levels.
- The price is trading above $2,240 and the 100-hourly Simple Moving Average.
- There is a key rising channel with support near $2,275 on the hourly chart of ETH/USD (data feed via Kraken).
- The pair could start a steady increase if there is a close above $2,320 and $2,350.
Ethereum price started a steady increase above the $2,180 resistance. ETH gained bullish momentum after there was a close above the $2,200 resistance.
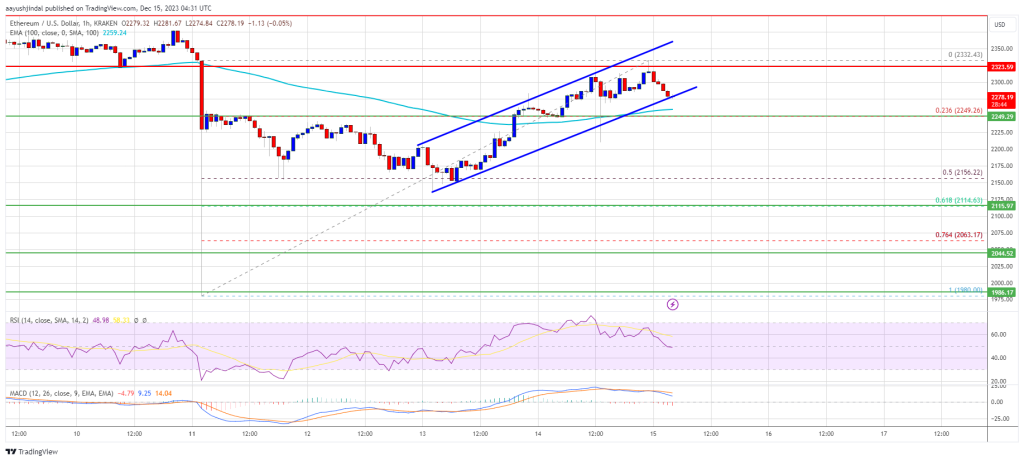
The price even spiked above the $2,300 level and settled above the 100-hourly Simple Moving Average. A high was formed near $2,332 and the price is consolidating gains. There was a minor bearish wave below the $2,300 level. However, Ethereum is still above $2,240 and the 100-hourly Simple Moving Average.
There is also a key rising channel with support near $2,275 on the hourly chart of ETH/USD. The channel support and the 100 hourly SMA are close to the 23.6% Fib retracement level of the upward move from the $1,980 swing low to the $2,332 high.
Source: ETHUSD on TradingView.com
On the upside, the price is facing resistance near the $2,320 level. The next key resistance is near the $2,350 level. The main resistance is still near $2,400. A clear move above the $2,400 zone could send the price toward the $2,500 level. The next resistance sits at $2,520. Any more gains could start a wave toward the $2,580 level.
Fresh Decline in ETH?If Ethereum fails to clear the $2,320 resistance, it could start a fresh decline. Initial support on the downside is near the $2,275 level or the 100-hourly Simple Moving Average and the channel trend line. The next key support is $2,165.
The main support is now near $2,120 or the 61.8% Fib retracement level of the upward move from the $1,980 swing low to the $2,332 high. A downside break below $2,120 might start another major decline. In the stated case, Ether could revisit the $2,000 support.
Technical Indicators
Hourly MACD – The MACD for ETH/USD is losing momentum in the bullish zone.
Hourly RSI – The RSI for ETH/USD is now above the 50 level.
Major Support Level – $2,275
Major Resistance Level – $2,320
Original source
Read on NewsBTCRelated market context

Uranium Holds Above $85 as Mining ETF Rebounds From June Sell-Off
The latest charts display that the market is divided into stable physical prices and uranium shares trying to regain momentum afte...

Tether USDT Briefly Overtakes Ethereum in Market Cap: A $187B Wake-Up Call
For a few hours, earlier this week, Tether USDT stablecoin held a higher market cap than Ethereum, the first time that has happene...

Blackrock’s IBIT Leads $86 Million Bitcoin ETF Inflow as Ethereum Funds Extend Outflow Streak
Spot bitcoin exchange-traded funds (ETFs) drew $85.85 million in net inflows on Friday, with every one of the 12 tracked funds avo...

Standard Chartered Says Bitcoin Bottomed Near $59,000 As Crypto Winter Ends
TL;DR Standard Chartered’s Geoffrey Kendrick reportedly says Bitcoin’s $59,000 area marked the cycle bottom. The note cites SpaceX...

Crypto Today: Bitcoin ETF Rumours, Ethereum Strength, and Mining Heat for Canadian Homes
Bitcoin ETF rumours lift sentiment, Ethereum recaptures $3,800, and North Vancouver uses mining heat for homes. Coinbase unveils p...

Google Gemini AI Predicts Jaw-Dropping XRP Price For Next 90 Days
Google Gemini AI just put XRP back under the spotlight, predicting it is tightly wound for a major breakout toward $1.60 to $1.80...