Ethereum Price Holds Ground As Indicators Suggest Rally To $2,800
Ethereum price climbed higher above the $2,600 resistance. ETH outpaced Bitcoin and is holding gains above the $2,580 support zone. Ethereum extended its increase above the $2,650 resistance zone. The price is trading ab...
Archive context
Older archive item. Useful for background and entity history, but not a fresh market-moving signal.

Ethereum price climbed higher above the $2,600 resistance. ETH outpaced Bitcoin and is holding gains above the $2,580 support zone.
- Ethereum extended its increase above the $2,650 resistance zone.
- The price is trading above $2,550 and the 100-hourly Simple Moving Average.
- There is a key bullish trend line forming with support at $2,590 on the hourly chart of ETH/USD (data feed via Kraken).
- The pair could start a downside correction if there is a move below the $2,580 support.
Ethereum price remained in a positive zone above the $2,500 resistance. ETH even outpaced BTC and climbed above the $2,650 resistance zone. A new multi-week high was formed near $2,683 before the price corrected gains.
There was a move below the $2,620 and $2,600 levels. The price tested the 23.6% Fib retracement level of the upward move from the $2,245 swing low to the $2,683 high. There is also a key bullish trend line forming with support at $2,590 on the hourly chart of ETH/USD.
Ethereum is now trading above $2,550 and the 100-hourly Simple Moving Average. If there is a fresh increase, the price might face resistance near the $2,640 level. The next major resistance is now near $2,680. A clear move above the $2,680 level might send ETH toward $2,720. A close above the $2,720 resistance could push the price further into a bullish zone.
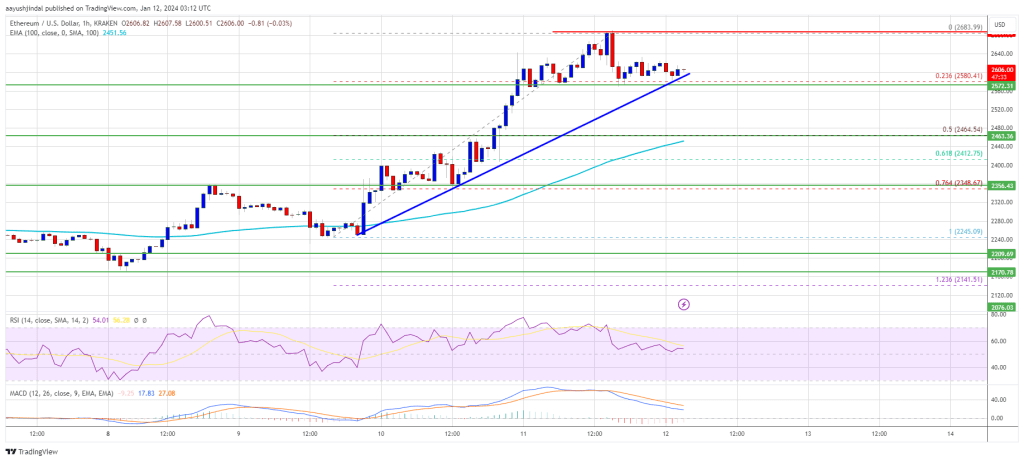
Source: ETHUSD on TradingView.com
The next key resistance is near $2,780. If the bulls push Ethereum above $2,780, there could be a rally toward $2,880. Any more gains might send the price toward the $3,000 zone.
Downside Correction in ETH?If Ethereum fails to clear the $2,680 resistance, it could start a downside correction. Initial support on the downside is near the $2,590 level and the trend line.
The first key support could be the $2,465 zone or the 50% Fib retracement level of the upward move from the $2,245 swing low to the $2,683 high. A downside break below the $2,465 support might send the price further lower. In the stated case, Ether could test the $2,350 support. Any more losses might send the price toward the $2,220 level.
Technical Indicators
Hourly MACD – The MACD for ETH/USD is losing momentum in the bullish zone.
Hourly RSI – The RSI for ETH/USD is now above the 50 level.
Major Support Level – $2,465
Major Resistance Level – $2,680
Why this matters
This ethereum story adds another data point to the current market tape and is useful when read alongside nearby source coverage.
Original source
Read on NewsBTCRelated market context

Ethereum Foundation sells 2,000 ETH as price hovers near $2,000
The Ethereum Foundation's ETH sales highlight the need for strategic treasury management, balancing liquidity with potential marke...

Lithium Market Outlook as $90,650 Spot Meets a Heavy ETF Resistance Wall in Q4
The Global X Lithium and Battery Tech ETF, on the other hand, dropped 2.64% to $59.46. This divergence indicates that there is not...

Ethereum Dancing on Two Fronts as Quantum Upgrade Advances and Treasury Leverage Bites
Ethereum developers want to upgrade the network to be quantum-ready by 2027, potentially accelerating one of its biggest security...
How Buterin Complicates Ethereum’s Wall Street Pitch by Aiming at Bitcoin
Vitalik Buterin’s latest pivot in how Ethereum should be valued might make traditional Wall Street investors dizzy. The narrative...

Bitcoin Price Today: Negative Funding Rates Signal Growing Bearish Bets as BTC Nears $68K
The latest data presents a mixed picture, however, as Hyperliquid whales have returned to net-long positions despite deteriorating...

XRP Price Today: $0.98 Support Under Threat Despite Oversold RSI
Deeply oversold indicators suggest a possible relief bounce, but the broader technical structure remains bearish. The XRP price ha...