Ethereum Price Holds Ground – Indicators Suggest Fresh Surge To $2,120
Ethereum price corrected lower and tested the $1,935 support. ETH is likely forming a double-bottom and might start a decent increase. Ethereum reacted to the downside and tested the $1,935 support. The price is trading...
Archive context
Older archive item. Useful for background and entity history, but not a fresh market-moving signal.

Ethereum price corrected lower and tested the $1,935 support. ETH is likely forming a double-bottom and might start a decent increase.
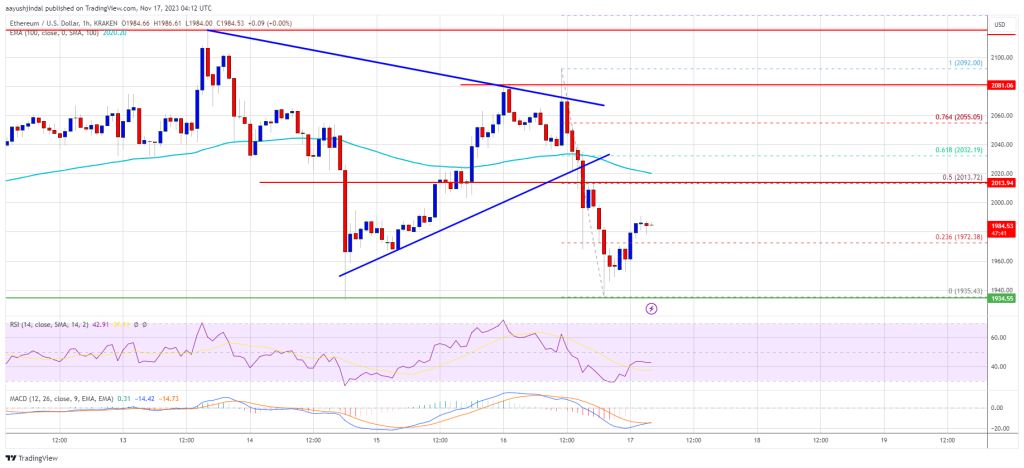
- Ethereum reacted to the downside and tested the $1,935 support.
- The price is trading below $2,020 and the 100-hourly Simple Moving Average.
- There was a break below a key contracting triangle with support near $2,025 on the hourly chart of ETH/USD (data feed via Kraken).
- The pair is likely forming a double-bottom pattern and might outperform Bitcoin.
After facing rejection near the $2,090 zone, Ethereum price reacted to the downside. ETH traded below the $2,050 and $2,020 support level to enter a short-term bearish zone, like Bitcoin.
There was also a break below a key contracting triangle with support near $2,025 on the hourly chart of ETH/USD. However, the bulls took a stand near the $1,935 support zone. It seems like Ether is likely forming a double-bottom pattern, while Bitcoin is forming a double-top near $38,000.
Ethereum is now trading above the 23.6% Fib retracement level of the downward move from the $2,092 swing high to the $1,935 low. Immediate resistance is near the $2,000 zone.
The first major resistance is near $2,020 or the 100-hourly Simple Moving Average. It is near the 61.8% Fib retracement level of the downward move from the $2,092 swing high to the $1,935 low. A close above the $2,020 resistance could start another strong increase.
Source: ETHUSD on TradingView.com
The next resistance is near $2,090, above which the price could aim for a move toward the $2,120 level. Any more gains could start a wave toward the $2,200 level.
More Losses in ETH?If Ethereum fails to clear the $2,020 resistance, it could start a fresh decline. Initial support on the downside is near the $1,950 level. The next key support is $1,935.
The main support is $1,920. A downside break below the $1,920 support might start a steady decline. In the stated case, Ether could drop toward the $1,850 support zone in the near term. Any more losses might call for a drop toward the $1,800 level.
Technical Indicators
Hourly MACD – The MACD for ETH/USD is losing momentum in the bullish zone.
Hourly RSI – The RSI for ETH/USD is now below the 50 level.
Major Support Level – $1,935
Major Resistance Level – $2,020
Why this matters
This ethereum story adds another data point to the current market tape and is useful when read alongside nearby source coverage.
Original source
Read on NewsBTCRelated market context

Ethereum Price Prediction: ETH Finally Breaks the Bear Pattern
Ethereum price trades at $2,675 after clearing a bull-flag structure that had capped its bullish prediction for weeks. The breakou...

Bitcoin Price Never Closed Below Expectation in 2026 Bear Market
Bitcoin never posted a daily close below its realized price during the current bear market, and the June 2026 low held above that...

Elon Musk Grok AI Predicts a Bold Move for Ethereum in 2026
When prompted, the Elon Musk-backed Grok AI predicts a bold move for Ethereum (ETH) over the remainder of 2026. It claims that if...

PeerDAS has operated successfully for nearly a year on Ethereum
PeerDAS enhances Ethereum's scalability and decentralization, reducing transaction costs and enabling broader participation withou...

Ethereum Slips Against Sterling as ETH/GBP Rate Holds Near £2,018
Ethereum trades at £2,017.54 per ETH against the pound, down 1.02% in a day. What the ETH/GBP rate move means for UK holders and c...

Ripple CEO Brad Garlinghouse Says XRP and Solana Can Both Thrive in Crypto’s Next 5 Years
Garlinghouse’s comments have resurfaced as XRP and Solana both trade near important technical levels following recent gains. “I’m...