Ethereum Price Holds Strong at $1,250: A Strengthening Case for Upside
Ethereum spiked above the $1,300 resistance zone against the US Dollar. ETH is correcting gains, but it remains supported near $1,250 and $1,230. Ethereum gained pace for a move above $1,300 before the bears appeared. Th...

Ethereum spiked above the $1,300 resistance zone against the US Dollar. ETH is correcting gains, but it remains supported near $1,250 and $1,230.
- Ethereum gained pace for a move above $1,300 before the bears appeared.
- The price is now trading above $1,250 and the 100 hourly simple moving average.
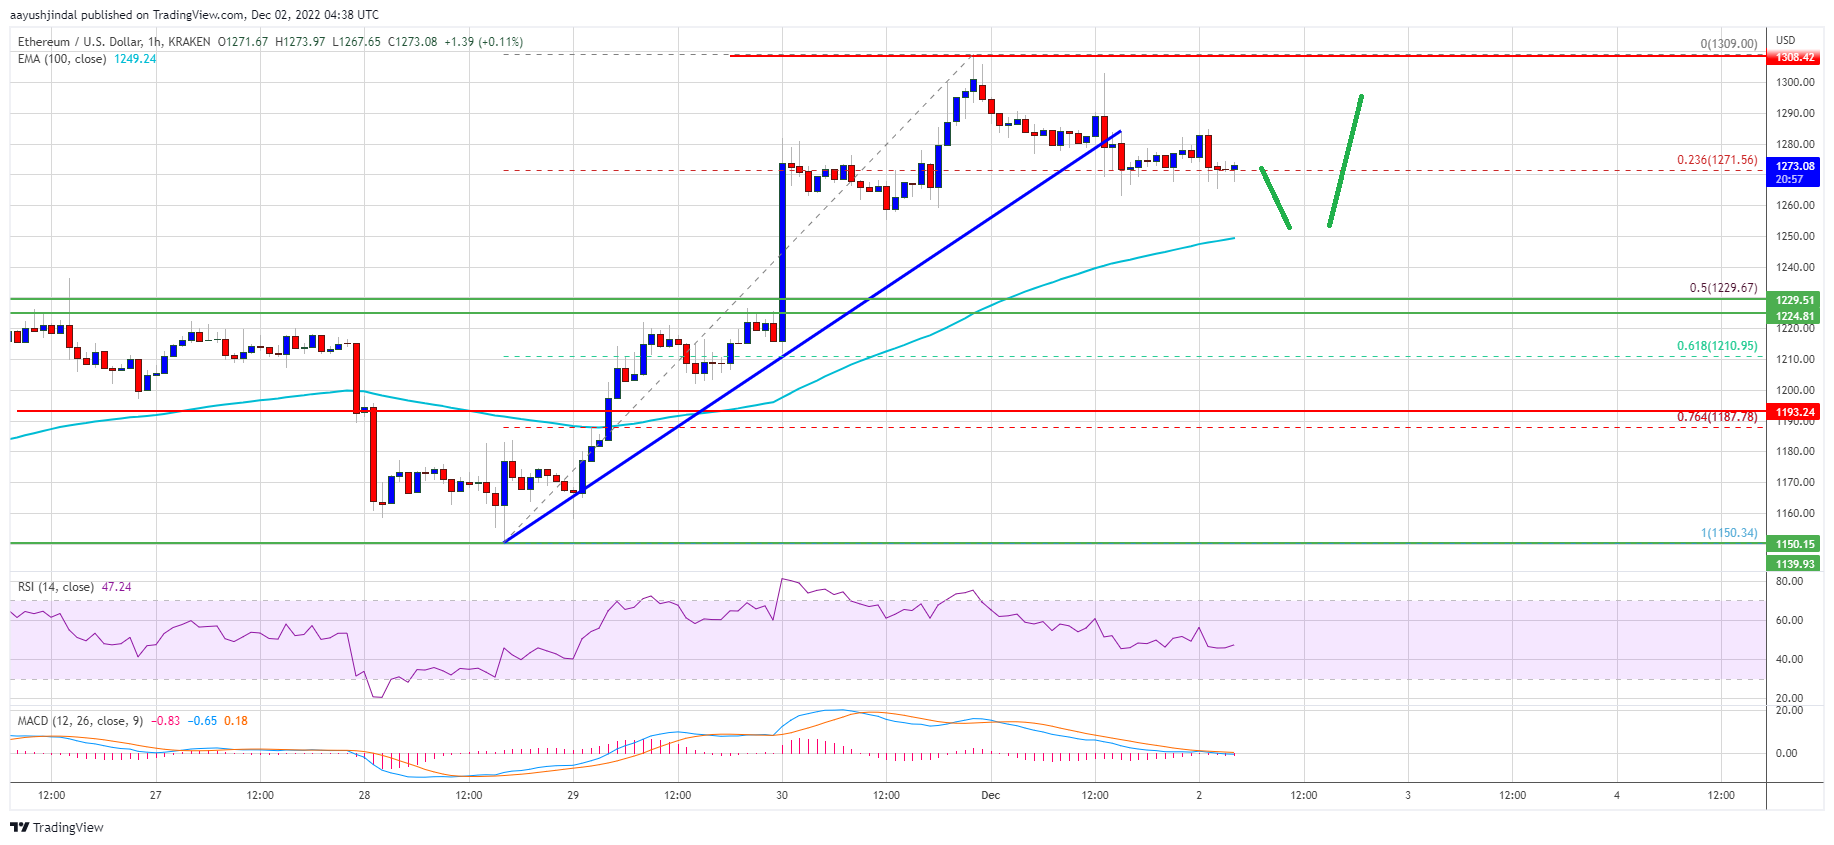
- There was a break below a major bullish trend line with support near $1,280 on the hourly chart of ETH/USD (data feed via Kraken).
- The pair could correct further lower towards the $1,250 and $1,230 support levels.
Ethereum price extended its increase above the $1,250 resistance zone. ETH even spiked above the $1,300 resistance zone and settled above the 100 hourly simple moving average, similar to bitcoin.
However, the bears were active abvoet the $1,300 resistance zone. Ether price traded as high as $1,309 before there was a downside correction. The price declined below the 23.6% Fib retracement level of the upward move from the $1,150 swing low to $1,309 high.
Besides, there was a break below a major bullish trend line with support near $1,280 on the hourly chart of ETH/USD. The pair is still trading above $1,250 and the 100 hourly simple moving average.
An immediate resistance on the upside is near the $1,290 level. The first major resistance is near the $1,300 level. A close above the $1,300 resistance might send the price further higher. The next major resistance is near the $1,350 level, above which ether price might test $1,400.
If the bulls remain in action above $1,400, the price could rise towards the $1,450 resistance zone. Any more gains might send the price towards the $1,500 resistance zone.
Dips Supported in ETH?If ethereum fails to start another increase above the $1,300 resistance, it could start a downside correction. An initial support on the downside is near the $1,250 level and the 100 hourly simple moving average.
The next major support is near the $1,230 level or the 50% Fib retracement level of the upward move from the $1,150 swing low to $1,309 high. If there is a break below $1,230, the price could test the $1,180 support. Any more losses could lead the price towards the $1,150 support.
Technical Indicators
Hourly MACD – The MACD for ETH/USD is now losing momentum in the bullish zone.
Hourly RSI – The RSI for ETH/USD is now just below the 50 level.
Major Support Level – $1,230
Major Resistance Level – $1,300
Featured Image by iStockOriginal source
Read on NewsBTCRelated market context

Uranium Holds Above $85 as Mining ETF Rebounds From June Sell-Off
The latest charts display that the market is divided into stable physical prices and uranium shares trying to regain momentum afte...

Standard Chartered Says Bitcoin Bottomed Near $59,000 As Crypto Winter Ends
TL;DR Standard Chartered’s Geoffrey Kendrick reportedly says Bitcoin’s $59,000 area marked the cycle bottom. The note cites SpaceX...

Bitcoin price challenges $64,000 weekend wall – needing a breakout or risk a deeper correction
Bitcoin reclaimed $64,000 on June 12 and touched an intraday high of $64,301 in the same session that spot ETF flows finally flipp...

Bitcoin rises above $64,000 after Pakistan prime minister says Iran peace deal is near
Bitcoin traded above $64,000 on Saturday, supported by its strongest ETF inflows in a month and growing optimism around geopolitic...

US forces shoot down Iranian attack drones near Strait of Hormuz, Bitcoin drops below $73K
Geopolitical tensions near vital oil routes can destabilize financial markets, highlighting the interconnectedness of global secur...

Fireblocks Says Institutional ETH Staking Is Moving Toward Standardized Rails
TL;DR Fireblocks says it has launched ETH Staking Link, a standardized interface for institutional Ethereum staking integrations....