Ethereum Price Holds Strong at $1,500: A Strengthening Case for Upside
Ethereum gained pace and broke the $1,500 resistance zone against the US Dollar. ETH is consolidating gains and might eye more upsides above $1,600. Ethereum is showing positive signs above the $1,500 and $1,520 levels....

Ethereum gained pace and broke the $1,500 resistance zone against the US Dollar. ETH is consolidating gains and might eye more upsides above $1,600.
- Ethereum is showing positive signs above the $1,500 and $1,520 levels.
- The price is now trading above $1,520 and the 100 hourly simple moving average.
- There is a major contracting triangle forming with resistance near $1,560 on the hourly chart of ETH/USD (data feed via Kraken).
- The pair could rally again if there is a clear move above $1,560 and $1,580.
Ethereum gained pace after it broke the $1,400 and $1,420 resistance levels. ETH even cleared the $1,500 level and settled above the 100 hourly simple moving average.
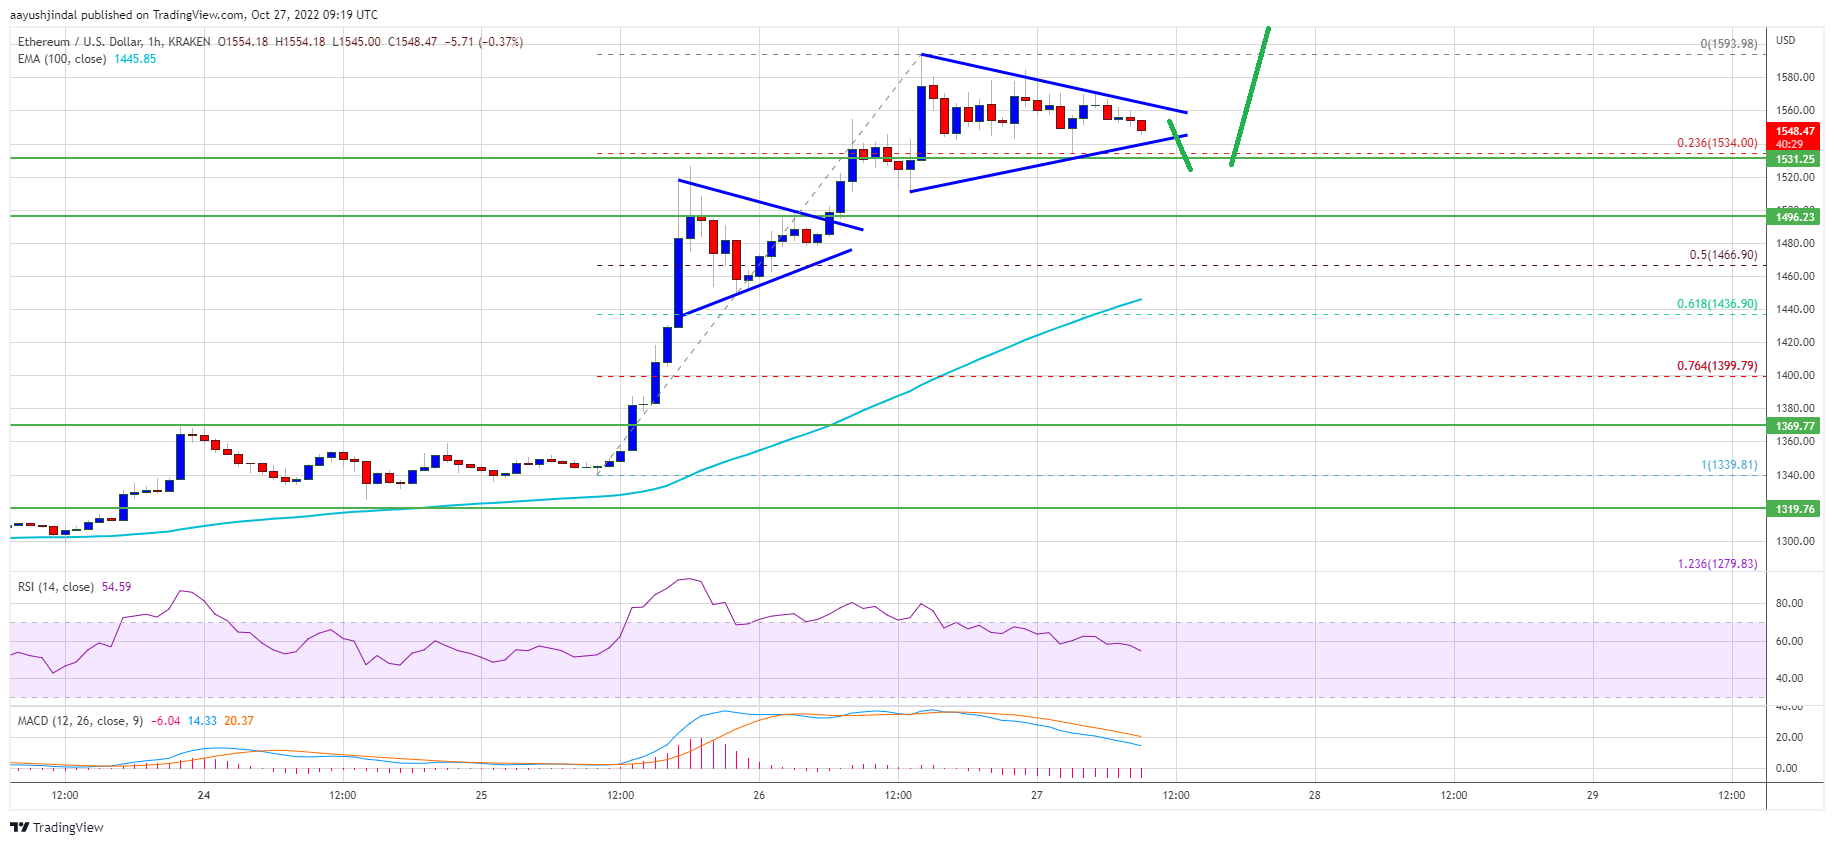
The price surged towards the $1,600 level and remained well bid. A high was formed near $1,593 before there was a downside correction. There was a move below the $1,580 level. Ether price even tested the 23.6% Fib retracement level of the upward move from the $1,339 swing low to $1,593 high.
It is now trading above $1,520 and the 100 hourly simple moving average. There is also a major contracting triangle forming with resistance near $1,560 on the hourly chart of ETH/USD.
Source: ETHUSD on TradingView.com
An immediate resistance on the upside is near the $1,560 level and the triangle trend line. The first major resistance is near the $1,580 and $1,585 levels. The main barrier is now near the $1,600 zone. A clear upside break above the $1,600 resistance zone could open the doors for a strong increase. In the stated case, the price might climb towards the $1,750 level.
Dips Limited in ETH?If ethereum fails to climb above the $1,580 resistance, it could start a downside correction. An initial support on the downside is near the $1,525 level and the triangle zone.
The next major support is near the $1,460 and $1,450 levels. It is near the 50% Fib retracement level of the upward move from the $1,339 swing low to $1,593 high. A downside break below the $1,450 zone might start a fresh decline to $1,400 in the near term.
Technical Indicators
Hourly MACD – The MACD for ETH/USD is now losing momentum in the bullish zone.
Hourly RSI – The RSI for ETH/USD is now above the 50 level.
Major Support Level – $1,450
Major Resistance Level – $1,580
Original source
Read on NewsBTCRelated market context

Tether USDT Briefly Overtakes Ethereum in Market Cap: A $187B Wake-Up Call
For a few hours, earlier this week, Tether USDT stablecoin held a higher market cap than Ethereum, the first time that has happene...

Uranium Holds Above $85 as Mining ETF Rebounds From June Sell-Off
The latest charts display that the market is divided into stable physical prices and uranium shares trying to regain momentum afte...

Standard Chartered Says Bitcoin Bottomed Near $59,000 As Crypto Winter Ends
TL;DR Standard Chartered’s Geoffrey Kendrick reportedly says Bitcoin’s $59,000 area marked the cycle bottom. The note cites SpaceX...

Crypto Today: Bitcoin ETF Rumours, Ethereum Strength, and Mining Heat for Canadian Homes
Bitcoin ETF rumours lift sentiment, Ethereum recaptures $3,800, and North Vancouver uses mining heat for homes. Coinbase unveils p...

Google Gemini AI Predicts Jaw-Dropping XRP Price For Next 90 Days
Google Gemini AI just put XRP back under the spotlight, predicting it is tightly wound for a major breakout toward $1.60 to $1.80...

Elon Musk SpaceX AI Predicts Incredible Bitcoin Price For Next 30 Days
Here is the thing about capitulation calls. They only sound smart in hindsight. Right now, with Bitcoin price scraping along the l...