Ethereum Price Holds Strong At $3K But Can Bulls Clear This Hurdle?
Ethereum price is consolidating near the $3,000 zone. ETH could start a decent recovery wave if it clears the $3,100 and $3,200 resistance levels. Ethereum is struggling to recover above the $3,100 resistance zone. The p...

Ethereum price is consolidating near the $3,000 zone. ETH could start a decent recovery wave if it clears the $3,100 and $3,200 resistance levels.
- Ethereum is struggling to recover above the $3,100 resistance zone.
- The price is trading below $3,120 and the 100-hourly Simple Moving Average.
- There is a major bearish trend line forming with resistance at $3,035 on the hourly chart of ETH/USD (data feed via Kraken).
- The pair could start another decline if it stays below the $3,100 resistance zone.
Ethereum price slowly moved lower after it failed to clear the $3,200 resistance zone. ETH remained in a bearish zone below $3,100 and showed bearish signs, like Bitcoin.
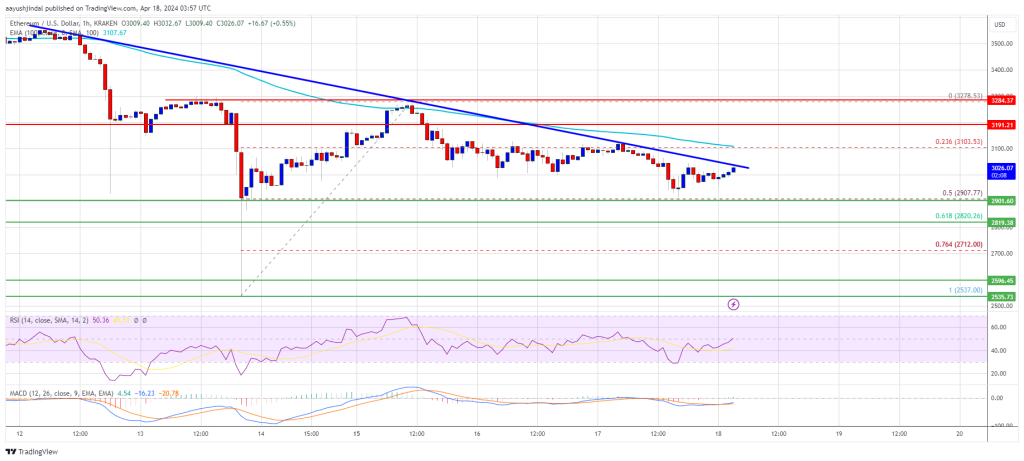
Recently, the bears were able to push the price below the $3,000 support zone. However, the bulls were active near the 50% Fib retracement level of the upward wave from the $2,535 swing low to the $3,279 high. Ethereum is now trading below $3,120 and the 100-hourly Simple Moving Average.
Immediate resistance is near the $3,030 level. There is also a major bearish trend line forming with resistance at $3,035 on the hourly chart of ETH/USD. The first major resistance is near the $3,100 level and the 100-hourly Simple Moving Average.
Source: ETHUSD on TradingView.com
The next key resistance sits at $3,200, above which the price might rise toward the $3,280 level. A close above the $3,280 resistance could send the price toward the $3,500 pivot level. If there is a move above the $3,500 resistance, Ethereum could even climb toward the $3,650 resistance in the coming sessions.
More Losses In ETH?If Ethereum fails to clear the $3,100 resistance, it could start another decline. Initial support on the downside is near the $3,000 level. The first major support is near the $2,900 zone.
The next key support could be the $2,820 zone or the 61.8% Fib retracement level of the upward wave from the $2,535 swing low to the $3,279 high. A clear move below the $2,820 support might send the price toward $2,600. Any more losses might send the price toward the $2,550 level in the near term.
Technical Indicators
Hourly MACD – The MACD for ETH/USD is gaining momentum in the bearish zone.
Hourly RSI – The RSI for ETH/USD is now below the 50 level.
Major Support Level – $2,900
Major Resistance Level – $3,100
Original source
Read on NewsBTCRelated market context

BTC News Today: Bitcoin Climbs Toward $66K as Trump Reveals US-Iran Peace Deal
The renewed geopolitical optimism helped improve risk sentiment across financial markets, pushing Bitcoin back toward the $66,000...

Bitcoin Stabilizes Near Key Zone, But Glassnode Warns Capital Flows Remain Weak
Bitcoin’s rebound from the $60,000 area has given bulls something to work with, but Glassnode’s latest market read suggests the re...

XRP Price Prediction: US-Iran Peace Deal Fuels 13% XRP Surge, Analysts Target $1.94 Retest
The latest move saw XRP price today reclaim the $1.28 level for the first time in nearly two weeks. Market participants pointed to...

XRP Price Analysis: Ripple Token Eyes 10% Gain with Flashing Bullish Pattern and ETF Inflows
XRP price posts 9% moves today from low $1.1 to $1.24, with a prediction that it could go even higher. Two independent tailwinds a...

Ethereum Research Proposal Targets Post-Quantum Wallet Security At Low Gas Cost
A new Ethereum Research proposal is putting post-quantum wallet security back in focus, outlining a practical way to verify quantu...

Bitcoin Price and Crypto Stocks Surge as Iran Ceasefire, Strategy’s $100M Buy Collide With Fed Week
Bitcoin Magazine Bitcoin Price and Crypto Stocks Surge as Iran Ceasefire, Strategy’s $100M Buy Collide With Fed Week Bitcoin price...