Ethereum Price Indicators Suggest A Strengthening Case For Surge Above $1,850
Ethereum price is still below the $1,840 resistance against the US Dollar. ETH could start a decent increase if it clears $1,840 and $1,850. Ethereum is currently facing a strong hurdle near the $1,850 resistance zone. T...

Ethereum price is still below the $1,840 resistance against the US Dollar. ETH could start a decent increase if it clears $1,840 and $1,850.
- Ethereum is currently facing a strong hurdle near the $1,850 resistance zone.
- The price is trading above $1,800 and the 100-hourly Simple Moving Average.
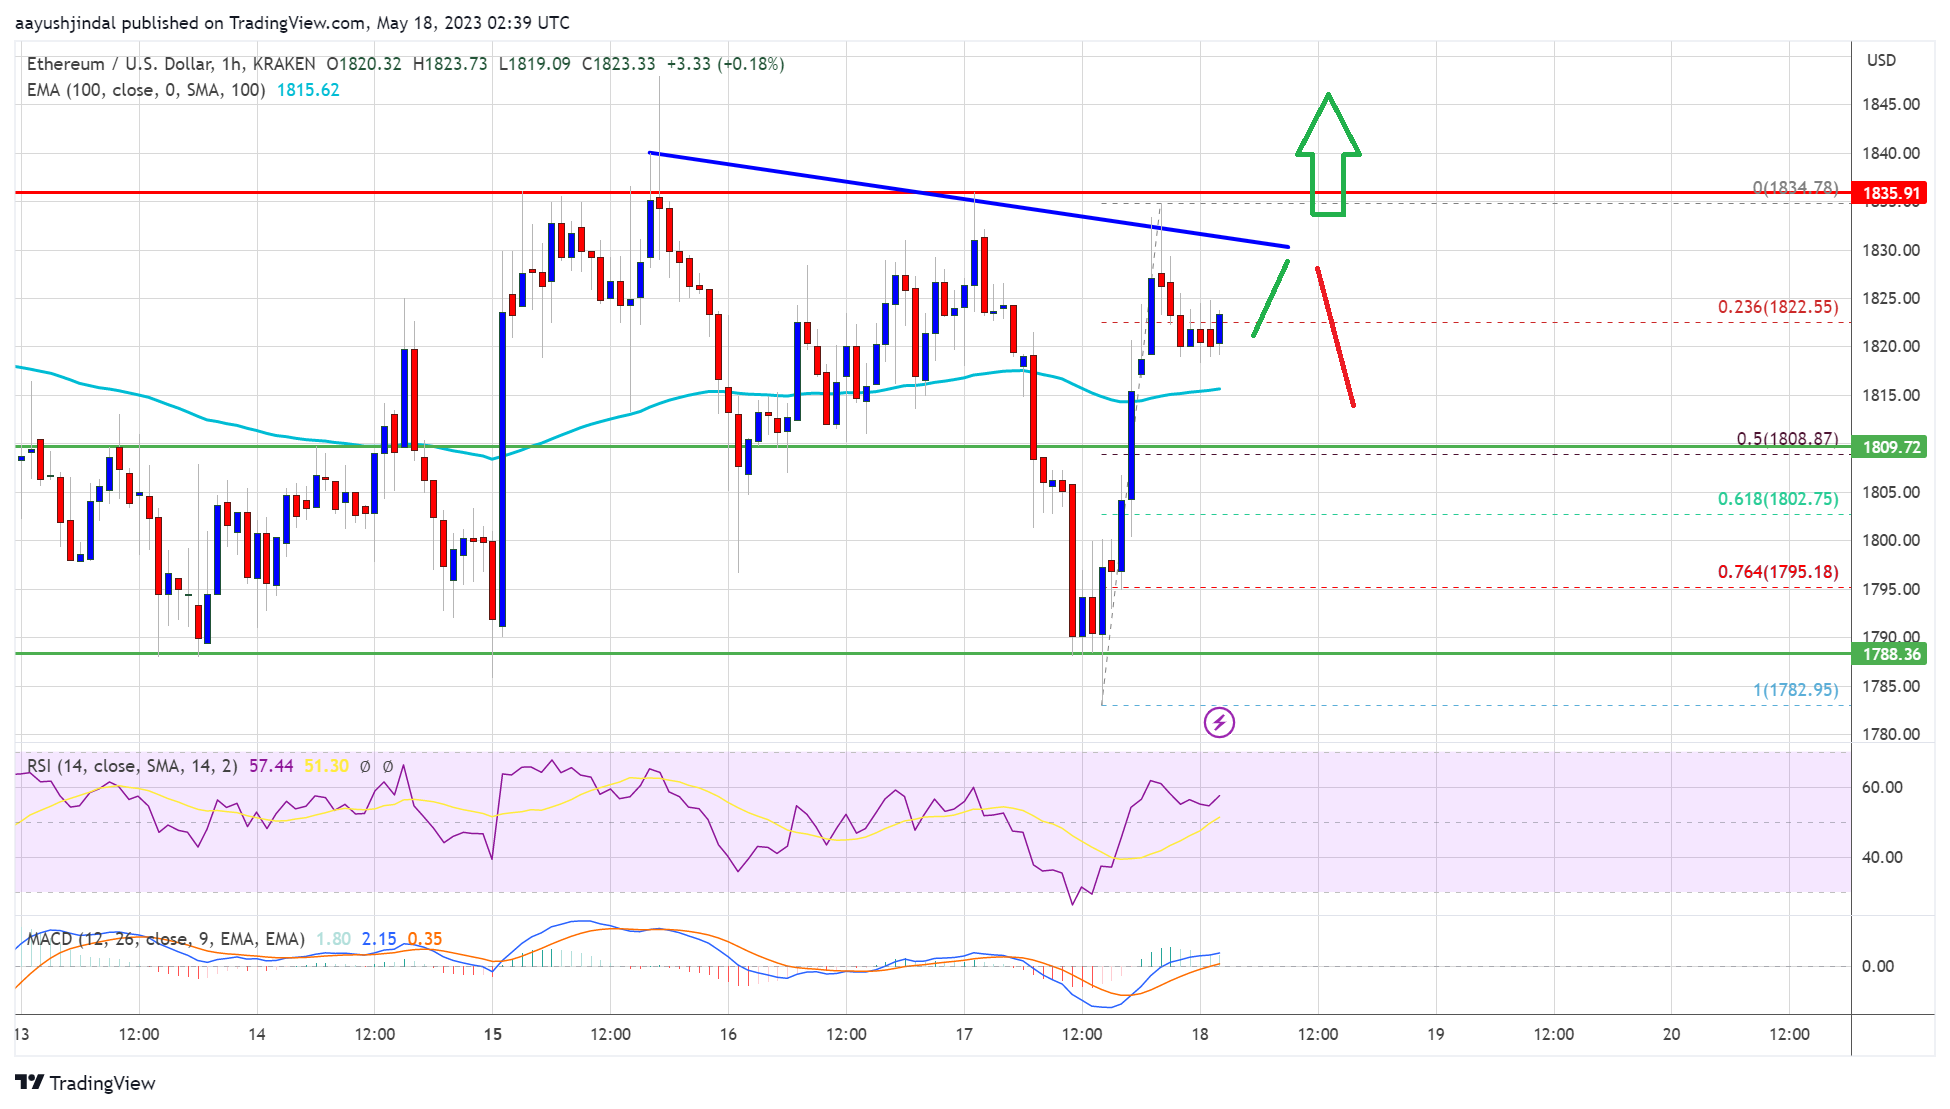
- There is a key bearish trend line forming with resistance near $1,830 on the hourly chart of ETH/USD (data feed via Kraken).
- The pair could start a fresh increase if it clears the $1,840 and $1,850 resistance levels.
Ethereum’s price started a decent upward move from the $1,780 support zone. ETH moved above the $1,800 and $1,820 resistance levels, similar to Bitcoin.
The price even spiked toward the $1,840 resistance where the bears emerged. A high is formed near $1,835 and the price is now consolidating gains. Ether is now trading above $1,800 and the 100-hourly Simple Moving Average.
It is also consolidating near the 23.6% Fib retracement level of the upward move from the $1,782 swing low to the $1,834 high. Immediate resistance is near the $1,830 level. There is also a key bearish trend line forming with resistance near $1,830 on the hourly chart of ETH/USD.
Source: ETHUSD on TradingView.com
The next resistance sits near $1,840, above which Ethereum could gain bullish momentum and rise toward $1,850. If there is a move above the $1,880 resistance level, the price might rise toward the $1,920 level. Any more gains above the $1,920 resistance zone could start a decent increase toward the $2,000 resistance.
Fresh Decline in ETH?If Ethereum fails to clear the $1,840 resistance, it could start a downside correction. Initial support on the downside is near the $1,815 level and 100 hourly SMA.
The next major support is near the $1,800 zone or the 50% Fib retracement level of the upward move from the $1,782 swing low to the $1,834 high. If there is a clear move below the $1,800 support, the price could gain bearish momentum. In the stated case, the price might drop toward the $1,780 support zone. Any more losses may perhaps take the price toward the $1,740 level in the near term.
Technical Indicators
Hourly MACD – The MACD for ETH/USD is gaining momentum in the bullish zone.
Hourly RSI – The RSI for ETH/USD is above the 50 level.
Major Support Level – $1,800
Major Resistance Level – $1,850
Original source
Read on NewsBTCRelated market context

Tether USDT Briefly Overtakes Ethereum in Market Cap: A $187B Wake-Up Call
For a few hours, earlier this week, Tether USDT stablecoin held a higher market cap than Ethereum, the first time that has happene...

Standard Chartered Says Bitcoin Bottomed Near $59,000 As Crypto Winter Ends
TL;DR Standard Chartered’s Geoffrey Kendrick reportedly says Bitcoin’s $59,000 area marked the cycle bottom. The note cites SpaceX...

Google Gemini AI Predicts Jaw-Dropping XRP Price For Next 90 Days
Google Gemini AI just put XRP back under the spotlight, predicting it is tightly wound for a major breakout toward $1.60 to $1.80...

Elon Musk SpaceX AI Predicts Incredible Bitcoin Price For Next 30 Days
Here is the thing about capitulation calls. They only sound smart in hindsight. Right now, with Bitcoin price scraping along the l...

Bitcoin price challenges $64,000 weekend wall – needing a breakout or risk a deeper correction
Bitcoin reclaimed $64,000 on June 12 and touched an intraday high of $64,301 in the same session that spot ETF flows finally flipp...

Michael Saylor says investor confidence in Ethereum has collapsed
Ethereum's declining investor confidence signals a shift towards Bitcoin dominance, emphasizing real-world utility over speculativ...