Ethereum Price is About to See “Liftoff” if It’s Able to Hold One Crucial Level
Ethereum price is still struggling to clear the $1,850 resistance against the US dollar. ETH might rally again if it clears $1,820 and $1,850. Ethereum is still facing a key barrier near the $1,850 zone. The price is tra...

Ethereum price is still struggling to clear the $1,850 resistance against the US dollar. ETH might rally again if it clears $1,820 and $1,850.
- Ethereum is still facing a key barrier near the $1,850 zone.
- The price is trading above $1,785 and the 100-hourly Simple Moving Average.
- There is a major rising channel forming with support near $1,800 on the hourly chart of ETH/USD (data feed via Kraken).
- The pair could extend its increase if it clears the $1,820 resistance.
Ethereum started a slow and steady increase from the $1,740 zone. ETH was able to reclaim the $1,800 resistance zone and avoided a major downside correction, like Bitcoin.
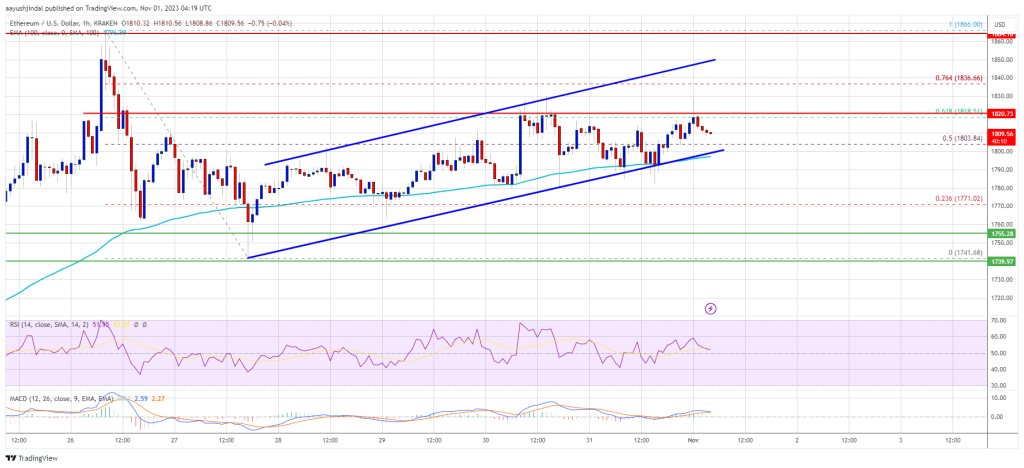
The bulls even pushed the price above the 50% Fib retracement level of the downside correction from the $1,865 swing high to the $1,740 low. Moreover, there is a major rising channel forming with support near $1,800 on the hourly chart of ETH/USD.
Ethereum is now trading above $1,785 and the 100-hourly Simple Moving Average. On the upside, the price is facing resistance near the $1,820 level. It is close to the 61.8% Fib retracement level of the downside correction from the $1,865 swing high to the $1,740 low.
If ETH surpasses the $1,820 resistance, it could rise toward the key barrier at $1,850. A close above the $1,850 resistance could start a fresh rally. In the stated case, the price could rally toward $1,950.
Source: ETHUSD on TradingView.com
The next key resistance is near $2,000, above which the price could accelerate higher. In the stated case, the price could rise toward the $2,120 level. The main hurdle sits at $2,250.
Bearish Wave in ETH?If Ethereum fails to clear the $1,820 resistance, it could start another decline. Initial support on the downside is near the $1,800 level, the 100-hourly Simple Moving Average, and the trend line.
The next key support is $1,770. The main support is now forming near the $1,750 and $1,740 levels. A downside break below the $1,740 support might spark a bearish wave. In the stated case, Ether could drop toward the $1,650 level.
Technical Indicators
Hourly MACD – The MACD for ETH/USD is losing momentum in the bullish zone.
Hourly RSI – The RSI for ETH/USD is now above the 50 level.
Major Support Level – $1,740
Major Resistance Level – $1,820
Original source
Read on NewsBTCRelated market context

Uranium Holds Above $85 as Mining ETF Rebounds From June Sell-Off
The latest charts display that the market is divided into stable physical prices and uranium shares trying to regain momentum afte...

Elon Musk SpaceX AI Predicts Incredible Bitcoin Price For Next 30 Days
Here is the thing about capitulation calls. They only sound smart in hindsight. Right now, with Bitcoin price scraping along the l...

Standard Chartered Says Bitcoin Bottomed Near $59,000 As Crypto Winter Ends
TL;DR Standard Chartered’s Geoffrey Kendrick reportedly says Bitcoin’s $59,000 area marked the cycle bottom. The note cites SpaceX...

Elon Musk’s trillionaire status puts his net worth above crypto’s entire market cap outside Bitcoin
Elon Musk has become the first person in modern history to amass a personal net worth exceeding $1 trillion, crossing the historic...

Google Gemini AI Predicts Jaw-Dropping XRP Price For Next 90 Days
Google Gemini AI just put XRP back under the spotlight, predicting it is tightly wound for a major breakout toward $1.60 to $1.80...

Bitcoin price challenges $64,000 weekend wall – needing a breakout or risk a deeper correction
Bitcoin reclaimed $64,000 on June 12 and touched an intraday high of $64,301 in the same session that spot ETF flows finally flipp...