Ethereum Price Just Saw Bearish Breakdown: Can Bulls Save The Day?
Ethereum price dropped further below $1,600 against the US Dollar. ETH is in the red zone and might dive toward the $1,500 support zone. Ethereum is gaining pace below the $1,600 support zone. The price is trading below...

Ethereum price dropped further below $1,600 against the US Dollar. ETH is in the red zone and might dive toward the $1,500 support zone.
- Ethereum is gaining pace below the $1,600 support zone.
- The price is trading below $1,600 and the 100-hourly Simple Moving Average.
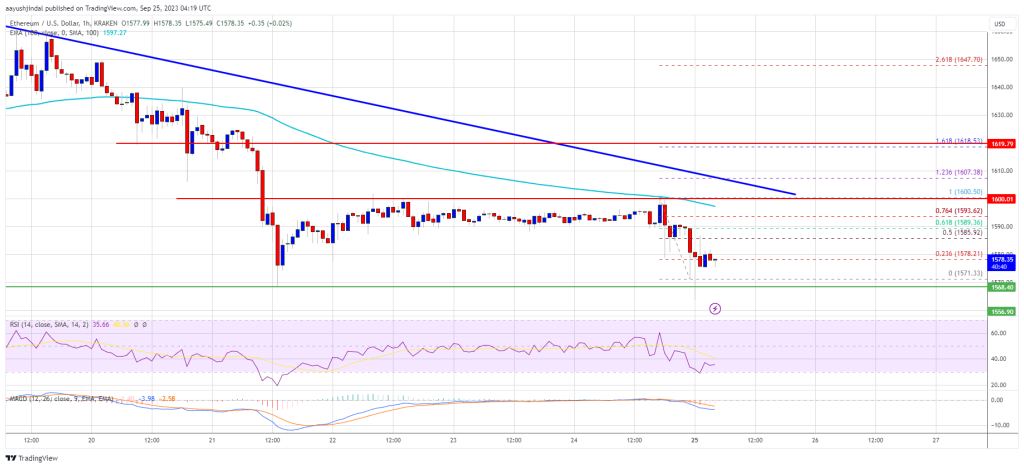
- There is a key bearish trend line forming with resistance near $1,600 on the hourly chart of ETH/USD (data feed via Kraken).
- The pair is struggling and might dive further toward the $1,500 support in the short term.
Ethereum’s price remained in a bearish zone below the $1,660 and $1,670 resistance levels. ETH declined below the $1,600 support level to move further enter a bearish zone, like Bitcoin.
The price even declined below the $1,580 level and settled below the 100-hourly Simple Moving Average. A low was formed near $1,571 and the price is now consolidating losses. The price is testing the 23.6% Fib retracement level of the recent decline from the $1,600 swing high to the $1,571 low.
Ether is now trading below $1,580 and the 100-hourly Simple Moving Average. There is also a key bearish trend line forming with resistance near $1,600 on the hourly chart of ETH/USD.
On the upside, the price might face resistance near the $1,590 level. It is close to the 61.8% Fib retracement level of the recent decline from the $1,600 swing high to the $1,571 low. The next major resistance is near $1,600 and the trend line.
Source: ETHUSD on TradingView.com
The main hurdle is now forming near $1,620. A close above the $1,620 resistance might send the price toward the $1,650 resistance. If the bulls pump Ethereum above $1,650, the price could rise toward $1,720. Any more gains might open the doors for a move toward $1,820.
More Losses in ETH?If Ethereum fails to clear the $1,600 resistance, it could start another decline. Initial support on the downside is near the $1,570 level.
The next key support is $1,540. A downside break below $1,540 might push the price further into a bearish zone. In the stated case, there could be a drop toward the $1,500 level.
Technical Indicators
Hourly MACD – The MACD for ETH/USD is gaining momentum in the bearish zone.
Hourly RSI – The RSI for ETH/USD is now below the 50 level.
Major Support Level – $1,570
Major Resistance Level – $1,600
Original source
Read on NewsBTCRelated market context

Tether USDT Briefly Overtakes Ethereum in Market Cap: A $187B Wake-Up Call
For a few hours, earlier this week, Tether USDT stablecoin held a higher market cap than Ethereum, the first time that has happene...

Bitcoin price challenges $64,000 weekend wall – needing a breakout or risk a deeper correction
Bitcoin reclaimed $64,000 on June 12 and touched an intraday high of $64,301 in the same session that spot ETF flows finally flipp...

Standard Chartered Says Bitcoin Bottomed Near $59,000 As Crypto Winter Ends
TL;DR Standard Chartered’s Geoffrey Kendrick reportedly says Bitcoin’s $59,000 area marked the cycle bottom. The note cites SpaceX...

US forces shoot down Iranian attack drones near Strait of Hormuz, Bitcoin drops below $73K
Geopolitical tensions near vital oil routes can destabilize financial markets, highlighting the interconnectedness of global secur...

XRP aims for $0.90 as ETF demand battles selling pressure from whales
XRP is trading at $1.11, down roughly 17% from its June opening, having set a new 2026 low on June 5 and shed $8 billion in market...

Uranium Holds Above $85 as Mining ETF Rebounds From June Sell-Off
The latest charts display that the market is divided into stable physical prices and uranium shares trying to regain momentum afte...