Ethereum Price Key Indicators Point Firming Case For Recovery Above $1,250
Ethereum is holding the key $1,150 support against the US Dollar. ETH is rising and might even clear the $1,250 resistance zone in the near term. Ethereum corrected lower, but the bulls were active near $1,150. The price...

Ethereum is holding the key $1,150 support against the US Dollar. ETH is rising and might even clear the $1,250 resistance zone in the near term.
- Ethereum corrected lower, but the bulls were active near $1,150.
- The price is now trading above $1,180 and the 100 hourly simple moving average.
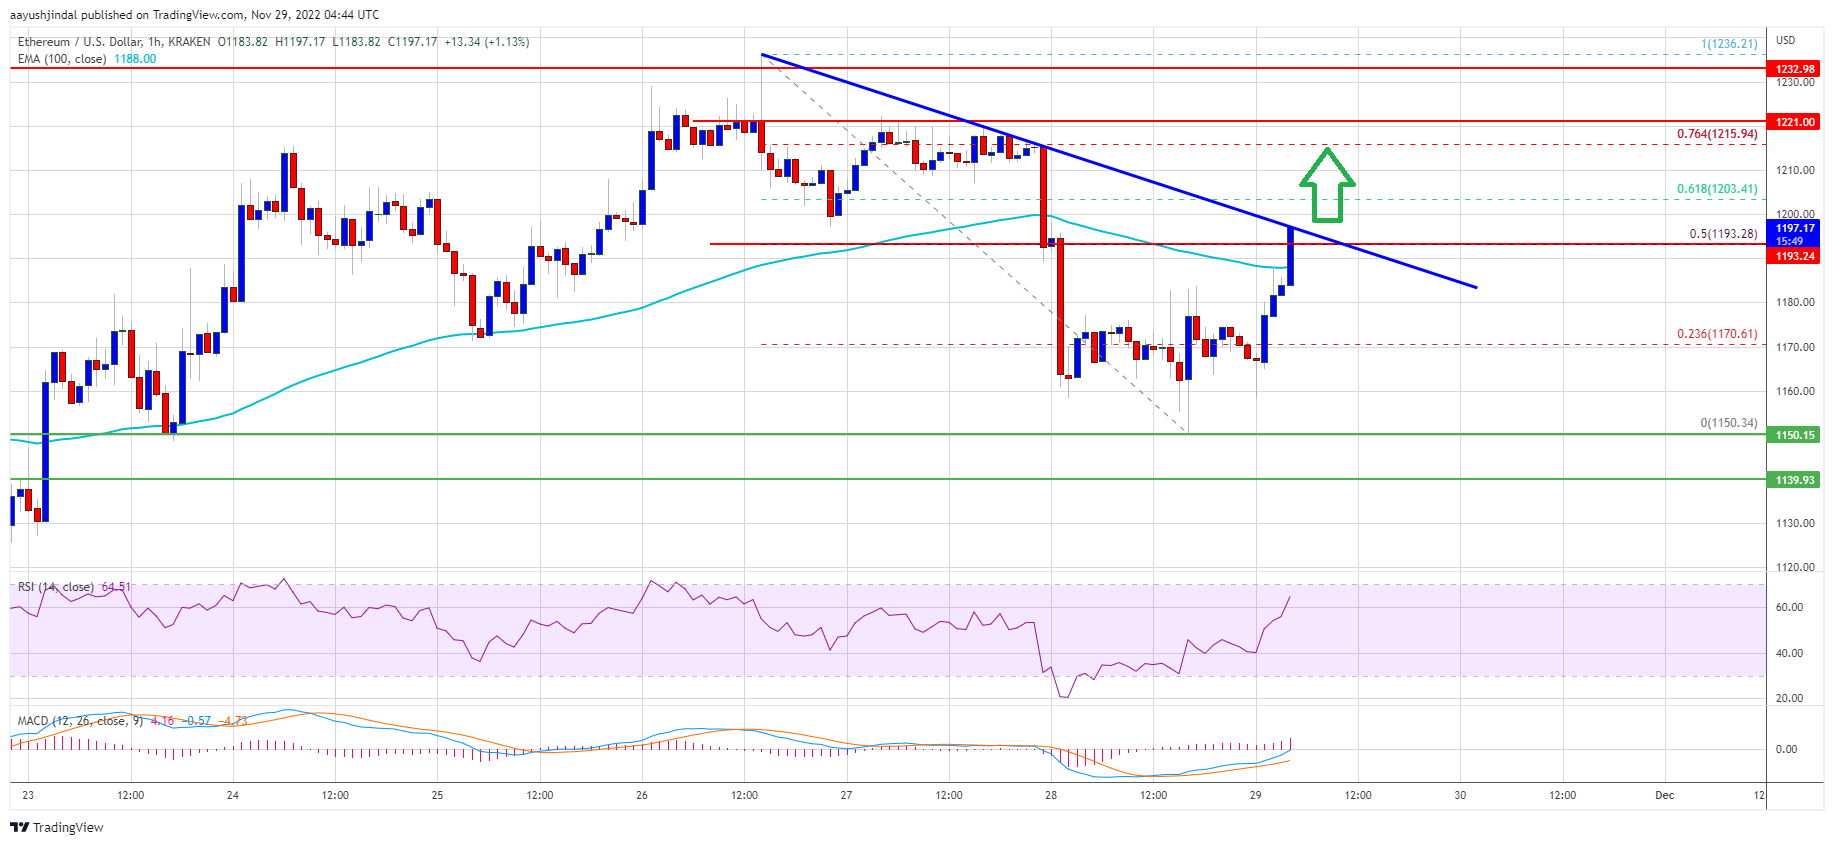
- There is a key bearish trend line forming with resistance near $1,195 on the hourly chart of ETH/USD (data feed via Kraken).
- The pair could rise steadily if it clears the $1,200 and $1,230 resistance levels.
Ethereum price started a downside correction from the $1,230 resistance. ETH declined below the $1,200 support zone and the 100 hourly simple moving average, similar to bitcoin.
However, the bulls were active near the $1,150 zone. A low was formed near $1,150 and the price started another decent increase. Ether price was able to clear the $1,165 and $1,180 resistance levels. There was a clear move above the 23.6% Fib retracement level of the recent decline from the $1,236 swing high to $1,150 low.
Ether price is now trading above $1,180 and the 100 hourly simple moving average. An immediate resistance on the upside is near the $1,195 level.
There is also a key bearish trend line forming with resistance near $1,195 on the hourly chart of ETH/USD. The trend line is near the 50% Fib retracement level of the recent decline from the $1,236 swing high to $1,150 low. The next major resistance is near the $1,230 level.
Source: ETHUSD on TradingView.com
The main breakout zone is near the $1,250 level. To start a strong increase, the price must settle above the $1,250 resistance. In the stated case, ether price could rise towards the $1,320 resistance zone. Any more gains might send the price towards the $1,420 resistance zone.
Fresh drop in ETH?If ethereum fails to climb above the $1,230 resistance, it could start another decline. An initial support on the downside is near the $1,170 level.
The next major support is near the $1,150 level. If there is a break below $1,150, the price could even decline below $1,130. In the stated scenario, the price could drop towards the $1,075 support zone.
Technical Indicators
Hourly MACD – The MACD for ETH/USD is now gaining momentum in the bullish zone.
Hourly RSI – The RSI for ETH/USD is now above the 50 level.
Major Support Level – $1,150
Major Resistance Level – $1,230
Featured image from iStockOriginal source
Read on NewsBTCRelated market context

Uranium Holds Above $85 as Mining ETF Rebounds From June Sell-Off
The latest charts display that the market is divided into stable physical prices and uranium shares trying to regain momentum afte...

Tether USDT Briefly Overtakes Ethereum in Market Cap: A $187B Wake-Up Call
For a few hours, earlier this week, Tether USDT stablecoin held a higher market cap than Ethereum, the first time that has happene...

Standard Chartered Says Bitcoin Bottomed Near $59,000 As Crypto Winter Ends
TL;DR Standard Chartered’s Geoffrey Kendrick reportedly says Bitcoin’s $59,000 area marked the cycle bottom. The note cites SpaceX...

Google Gemini AI Predicts Jaw-Dropping XRP Price For Next 90 Days
Google Gemini AI just put XRP back under the spotlight, predicting it is tightly wound for a major breakout toward $1.60 to $1.80...

Blackrock’s IBIT Leads $86 Million Bitcoin ETF Inflow as Ethereum Funds Extend Outflow Streak
Spot bitcoin exchange-traded funds (ETFs) drew $85.85 million in net inflows on Friday, with every one of the 12 tracked funds avo...

Elon Musk’s trillionaire status puts his net worth above crypto’s entire market cap outside Bitcoin
Elon Musk has become the first person in modern history to amass a personal net worth exceeding $1 trillion, crossing the historic...