Ethereum Price Loses Steam – This Resistance Could Spark Another Decline
Ethereum price jumped above the $2,280 resistance zone. ETH could gain bullish momentum if it clears the $2,330 resistance zone. Ethereum started a decent increase above the $2,250 resistance zone. The price is trading a...

Ethereum price jumped above the $2,280 resistance zone. ETH could gain bullish momentum if it clears the $2,330 resistance zone.
- Ethereum started a decent increase above the $2,250 resistance zone.
- The price is trading above $2,280 and the 100-hourly Simple Moving Average.
- There was a break above a connecting bearish trend line with resistance near $2,260 on the hourly chart of ETH/USD (data feed via Kraken).
- The pair might struggle to clear the $2,325 resistance zone and might correct lower.
Ethereum price started a decent increase above the $2,250 resistance zone. ETH cleared the $2,280 resistance zone like Bitcoin to start a steady recovery wave.
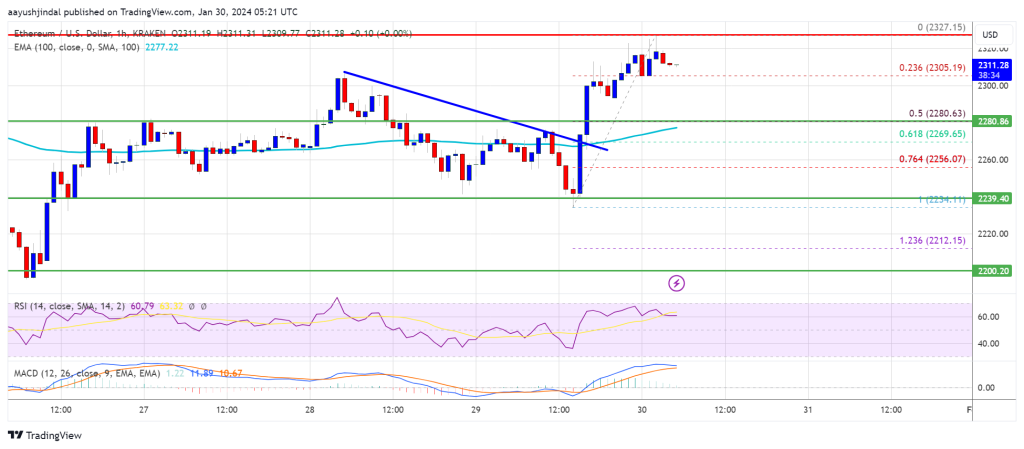
The bulls even pushed the price above the $2,300 resistance. There was a break above a connecting bearish trend line with resistance near $2,260 on the hourly chart of ETH/USD. A new weekly high was formed near $2,327 and the price is now consolidating gains.
It is now trading above the 23.6% Fib retracement level of the upward move from the $2,234 swing low to the $2,327 high. Ethereum is also trading above $2,280 and the 100-hourly Simple Moving Average.
Source: ETHUSD on TradingView.com
On the upside, the first major resistance is near the $2,330 level. The next major resistance is near $2,350, above which the price might rise and test the $2,420 resistance. If the bulls push the price above the $2,420 resistance, they could aim for $2,450. A clear move above the $2,450 level might start a decent increase. In the stated case, the price could rise toward the $2,550 level.
Another Bearish Wave in ETH?If Ethereum fails to clear the $2,330 resistance, it could start another decline. Initial support on the downside is near the $2,300 level.
The next key support could be the $2,280 zone or the 50% Fib retracement level of the upward move from the $2,234 swing low to the $2,327 high. A daily close below the $2,280 support might start another major decline. In the stated case, Ether could test the $2,200 support. Any more losses might send the price toward the $2,120 level.
Technical Indicators
Hourly MACD – The MACD for ETH/USD is losing momentum in the bullish zone.
Hourly RSI – The RSI for ETH/USD is now above the 50 level.
Major Support Level – $2,280
Major Resistance Level – $2,330
Original source
Read on NewsBTCRelated market context

Ethereum Price Prediction: ETH is Still Below Its 200 Week SMA, and Tom Lee Buying Spree Might End Soon
Ethereum price is trading above $1,700 after running for 5% today, and even our prediction model is calling for more leg higher. H...

Bitcoin Stabilizes Near Key Zone, But Glassnode Warns Capital Flows Remain Weak
Bitcoin’s rebound from the $60,000 area has given bulls something to work with, but Glassnode’s latest market read suggests the re...

Ethereum News: Last Chance to Buy Ethereum Under $2K? ETH USD Powers Up After Hormuz Peace Deal
In the latest Ethereum News, Ethereum ETH Price is trading at $1,739 up 4% in 24 hours, as risk assets catch a bid following the H...

Bitcoin Price and Crypto Stocks Surge as Iran Ceasefire, Strategy’s $100M Buy Collide With Fed Week
Bitcoin Magazine Bitcoin Price and Crypto Stocks Surge as Iran Ceasefire, Strategy’s $100M Buy Collide With Fed Week Bitcoin price...

BTC News Today: Bitcoin Climbs Toward $66K as Trump Reveals US-Iran Peace Deal
The renewed geopolitical optimism helped improve risk sentiment across financial markets, pushing Bitcoin back toward the $66,000...

XRP Price Analysis: Ripple Token Eyes 10% Gain with Flashing Bullish Pattern and ETF Inflows
XRP price posts 9% moves today from low $1.1 to $1.24, with a prediction that it could go even higher. Two independent tailwinds a...