Ethereum Price Near Make-or-Break Levels, Can ETH Start Steady Recovery
Ethereum started a recovery wave above the $1,210 level against the US Dollar. ETH must clear $1,260 and the 100 hourly SMA to start a decent recovery wave. Ethereum started a recovery wave above the $1,200 and $1,220 le...

Ethereum started a recovery wave above the $1,210 level against the US Dollar. ETH must clear $1,260 and the 100 hourly SMA to start a decent recovery wave.
- Ethereum started a recovery wave above the $1,200 and $1,220 levels.
- The price is now trading below $1,280 and the 100 hourly simple moving average.
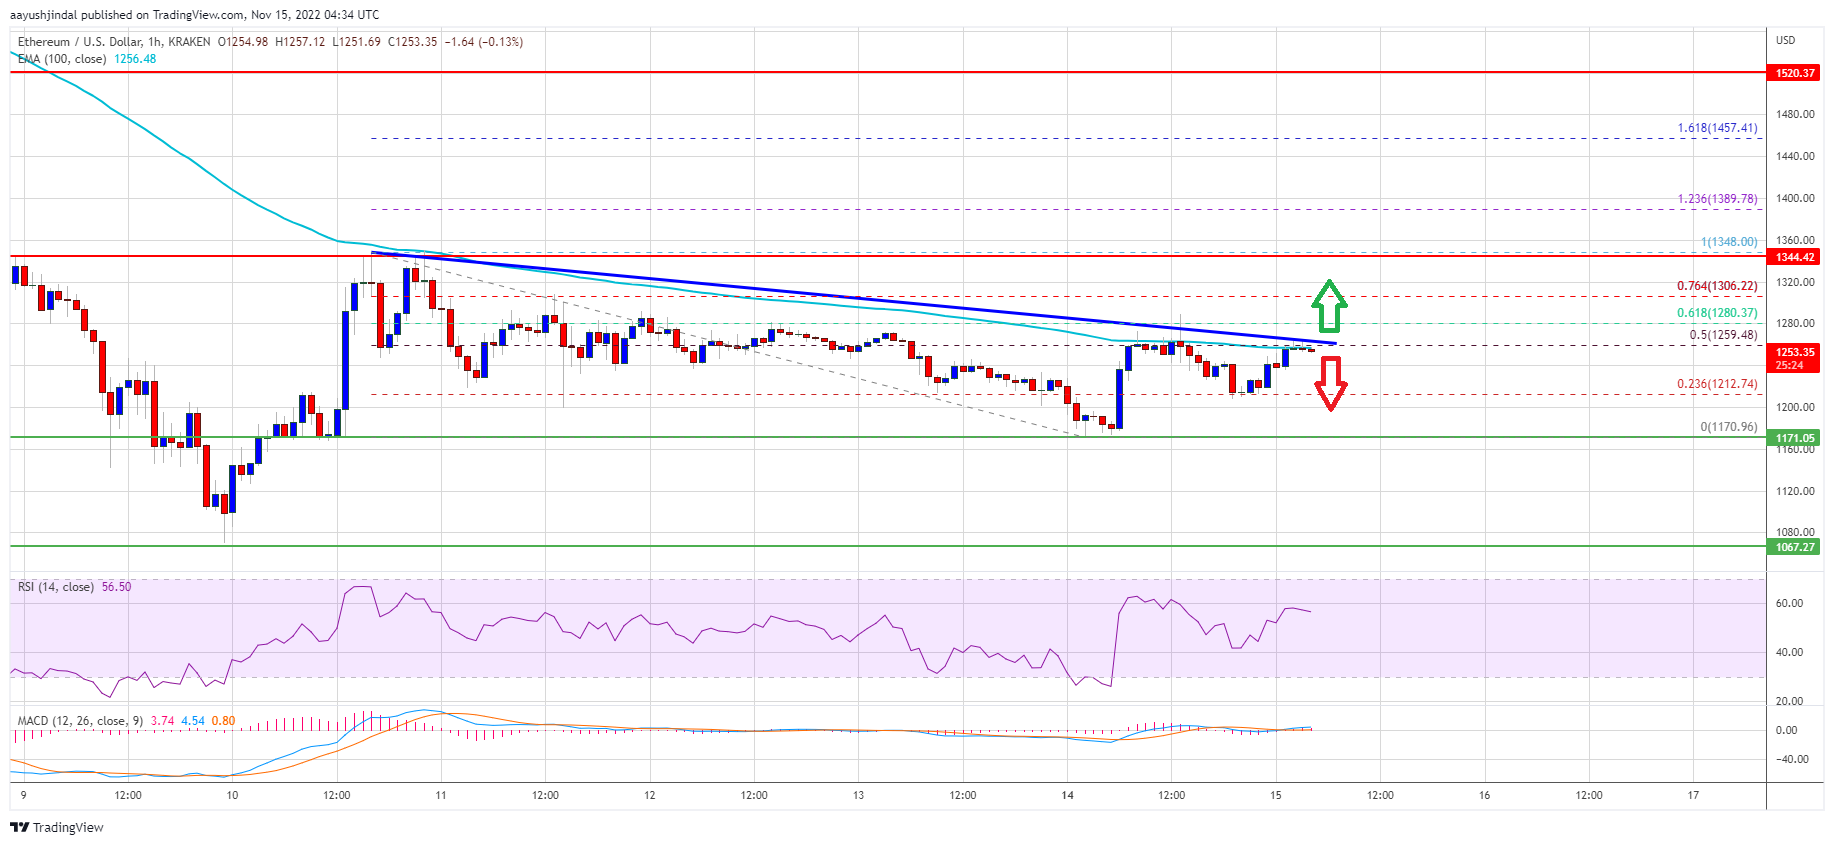
- There is a key bearish trend line forming with resistance near $1,260 on the hourly chart of ETH/USD (data feed via Kraken).
- The pair is now struggling to clear the $1,260 resistance and the 100 hourly simple moving average.
Ethereum reacted to the downside after it failed to clear $1,300, similar to bitcoin. ETH traded below the $1,220 support level and settled below the 100 hourly simple moving average.
It even spiked below $1,200 and traded as low as $1,170. Recently, there was an upside correction above the $1,200 and $1,220 levels. Ether price climbed above the 23.6% Fib retracement level of the recent decline from the $1,348 swing high to $1,170 low.
Ether price is now trading below $1,280 and the 100 hourly simple moving average. An immediate resistance on the upside is near the $1,260 level. There is also a key bearish trend line forming with resistance near $1,260 on the hourly chart of ETH/USD.
The trend line is near the 50% Fib retracement level of the recent decline from the $1,348 swing high to $1,170 low. The next major resistance is near the $1,300 level. A clear break above the $1,300 resistance could set the pace for a decent increase.
Source: ETHUSD on TradingView.com
In the stated case, the price could rise to the $1,350 level. Any more gains might send the price toward the $1,400 resistance zone.
Fresh Decline in ETH?If ethereum fails to climb above the $1,300 resistance, it could start another decline. An initial support on the downside is near the $1,210 level.
The next major support is near the $1,170 level, below which ether price may perhaps accelerate lower. In the stated scenario, the price could decline towards the $1,100 support zone in the near term.
Technical Indicators
Hourly MACD – The MACD for ETH/USD is now losing momentum in the bullish zone.
Hourly RSI – The RSI for ETH/USD is now above the 50 level.
Major Support Level – $1,170
Major Resistance Level – $1,300
Original source
Read on NewsBTCRelated market context

Standard Chartered Says Bitcoin Bottomed Near $59,000 As Crypto Winter Ends
TL;DR Standard Chartered’s Geoffrey Kendrick reportedly says Bitcoin’s $59,000 area marked the cycle bottom. The note cites SpaceX...

Bitcoin price faces new risk as big buyers lose conviction
Bitcoin’s largest buyers are no longer behaving like a reliable backstop for the largest cryptocurrency. The exchange-traded funds...

Bitcoin rises above $64,000 after Pakistan prime minister says Iran peace deal is near
Bitcoin traded above $64,000 on Saturday, supported by its strongest ETF inflows in a month and growing optimism around geopolitic...

US forces shoot down Iranian attack drones near Strait of Hormuz, Bitcoin drops below $73K
Geopolitical tensions near vital oil routes can destabilize financial markets, highlighting the interconnectedness of global secur...

Bitcoin price challenges $64,000 weekend wall – needing a breakout or risk a deeper correction
Bitcoin reclaimed $64,000 on June 12 and touched an intraday high of $64,301 in the same session that spot ETF flows finally flipp...

Bitcoin faces one of its biggest mining difficulty drops as miner margins collapse
The Bitcoin network is poised to execute one of the largest downward adjustments to its mining difficulty in its 17-year history t...