Ethereum Price Need Breakout – Key Hurdles Before Rally Can Continue
Ethereum price started a fresh decline below $4,620. ETH is now trading below $4,620 and might extend losses if it stays below $4,585. Ethereum is now correcting gains below the $4,620 zone. The price is trading below $4...
Archive context
Older archive item. Useful for background and entity history, but not a fresh market-moving signal.

Ethereum price started a fresh decline below $4,620. ETH is now trading below $4,620 and might extend losses if it stays below $4,585.
- Ethereum is now correcting gains below the $4,620 zone.
- The price is trading below $4,600 and the 100-hourly Simple Moving Average.
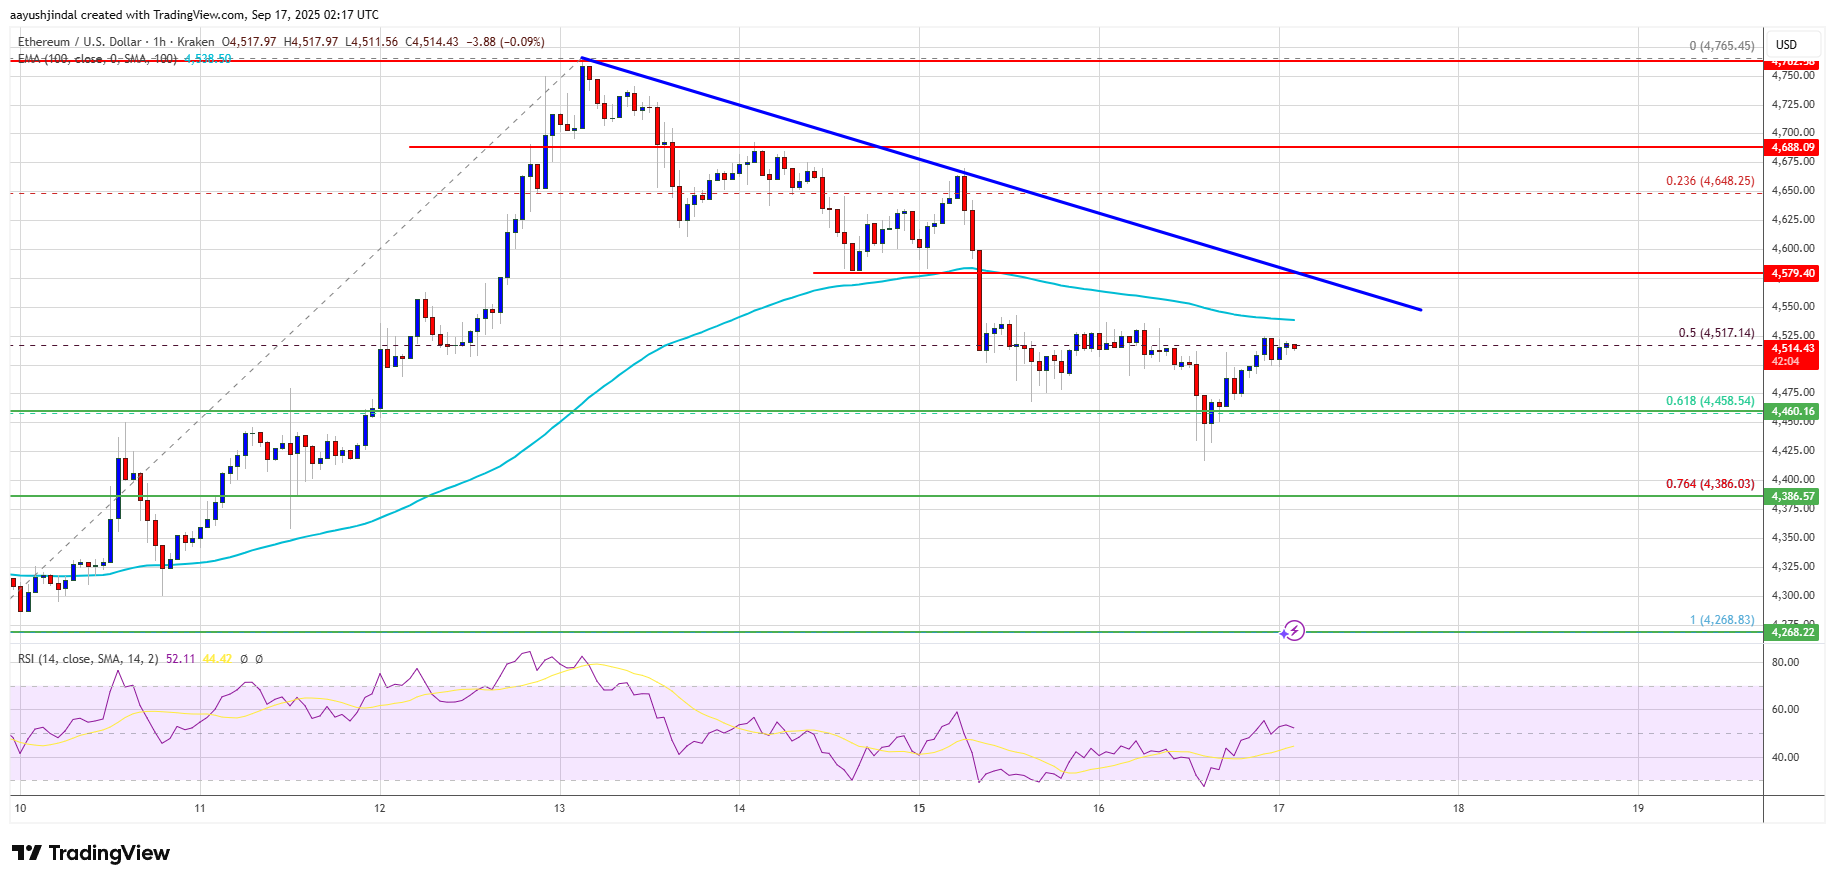
- There is a bearish trend line forming with resistance at $4,580 on the hourly chart of ETH/USD (data feed via Kraken).
- The pair could start a fresh increase if it settles above $4,580 and $4,620.
Ethereum price started a fresh decline after it failed to stay above the $4,650 zone, like Bitcoin. ETH price corrected gains and dipped below the $4,600 support.
There was a move below the 50% Fib retracement level of the upward move from the $4,268 swing low to the $4,765 high. The bears were able to push the price below $4,500 and the 100-hourly Simple Moving Average. Besides, there is a bearish trend line forming with resistance at $4,580 on the hourly chart of ETH/USD.
Ethereum price is now trading below $4,560 and the 100-hourly Simple Moving Average. On the upside, the price could face resistance near the $4,550 level. The next key resistance is near the $4,580 level and the trend line.
The first major resistance is near the $4,620 level. A clear move above the $4,620 resistance might send the price toward the $4,665 resistance. An upside break above the $4,665 resistance might call for more gains in the coming sessions. In the stated case, Ether could rise toward the $4,720 resistance zone or even $4,740 in the near term.
Another Decline In ETH?If Ethereum fails to clear the $4,580 resistance, it could start a fresh decline. Initial support on the downside is near the $4,480 level. The first major support sits near the $4,450 zone and the 61.8% Fib retracement level of the upward move from the $4,268 swing low to the $4,765 high.
A clear move below the $4,450 support might push the price toward the $4,380 support. Any more losses might send the price toward the $4,320 region in the near term. The next key support sits at $4,250.
Technical Indicators
Hourly MACD – The MACD for ETH/USD is losing momentum in the bullish zone.
Hourly RSI – The RSI for ETH/USD is now below the 50 zone.
Major Support Level – $4,450
Major Resistance Level – $4,580
Why this matters
This ethereum story adds another data point to the current market tape and is useful when read alongside nearby source coverage.
Original source
Read on NewsBTCRelated market context

XRP Price Prediction: XRP Faces Critical Resistance Near $1.17 Despite Ripple Securing Landmark EU License
While the company secured a full MiCA license that expands its operations across the European Economic Area, market indicators sug...

Ethereum is losing ownership of crypto payments as Base moves $565B in stablecoins
Stablecoin activity is becoming a contest over which blockchains move the most tokenized dollars. Visa Onchain Analytics showed th...

US-Iran Strikes and $7.7B Stablecoin Exit Put Bitcoin at $62,870
In the latest Bitcoin news, Bitcoin saw BTC price drop to $62,870 on Wednesday after stalling at the $64,000 resistance zone, with...

Ethereum’s treasury boom now has one company nearing 5% of supply
Ethereum treasury company BitMine said it now holds 5,742,237 ETH, or 4.8% of Ethereum's (ETH) 120.7 million token supply, putting...

Crypto News, July 8: U.S. Strikes Iran Again, Ethereum Price Wobbles After Bitcoin Spot Sell-Off
Crypto markets woke up to fresh news as U.S. strikes hit Iran again. The Bitcoin price is stuck chopping between $62,000 and $64,5...

Sam Altman ChatGPT AI Predicts Insane Bitcoin Price by 2026
Sam Altman ChatGPT AI just circled November on the calendar and put a number next to Bitcoin Price Prediction. The model predicts...