Ethereum Price Nosedives Over 5%, Pressure Mounts on Bulls
Ethereum price is down over 5% and trading below $2,350l. ETH is signaling an increase in selling pressure and might drop to $2,120. Ethereum started another decline after it failed to clear $2,450. The price is trading...

Ethereum price is down over 5% and trading below $2,350l. ETH is signaling an increase in selling pressure and might drop to $2,120.
- Ethereum started another decline after it failed to clear $2,450.
- The price is trading below $2,320 and the 100-hourly Simple Moving Average.
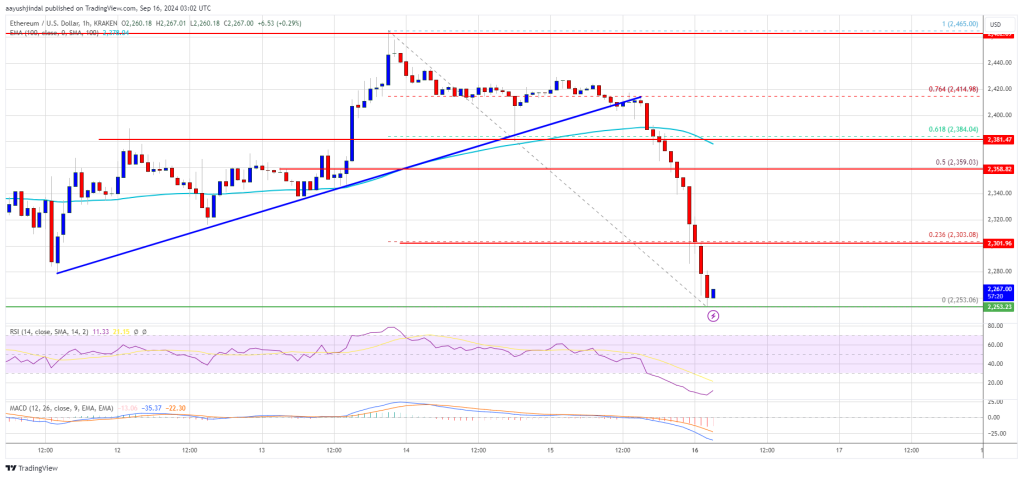
- There was a break below a key bullish trend line with support at $2,400 on the hourly chart of ETH/USD (data feed via Kraken).
- The pair must clear the $2,320 resistance to start a recovery wave in the near term.
Ethereum price failed to clear the $2,450 resistance and started another decline like Bitcoin. ETH declined more than BTC and broke key supports at $2,400.
There was a break below a key bullish trend line with support at $2,400 on the hourly chart of ETH/USD. The pair is down over 5% and there was a move below the $2,320 support zone. A low is formed at $2,253 and the price is now consolidating losses.
Ethereum price is now trading below $2,320 and the 100-hourly Simple Moving Average. On the upside, the price seems to be facing hurdles near the $2,300 level or the 23.6% Fib retracement level of the downward move from the $2,465 swing high to the $2,253 low.
The first major resistance is near the $2,320 level. A close above the $2,320 level might send Ether toward the $2,360 resistance. The next key resistance is near $2,385 or the 61.8% Fib retracement level of the downward move from the $2,465 swing high to the $2,253 low. An upside break above the $2,385 resistance might call for more gains toward the $2,450 resistance zone in the near term.
More Downsides In ETH?If Ethereum fails to clear the $2,320 resistance, it could start another decline in the near term. Initial support on the downside is near $2,250. The first major support sits near the $2,200 zone.
A clear move below the $2,200 support might push the price toward $2,150. Any more losses might send the price toward the $2,120 support level in the near term. The next key support sits at $2,050.
Technical Indicators
Hourly MACD – The MACD for ETH/USD is gaining momentum in the bearish zone.
Hourly RSI – The RSI for ETH/USD is now below the 50 zone.
Major Support Level – $2,250
Major Resistance Level – $2,320
Original source
Read on NewsBTCRelated market context

Bitcoin price challenges $64,000 weekend wall – needing a breakout or risk a deeper correction
Bitcoin reclaimed $64,000 on June 12 and touched an intraday high of $64,301 in the same session that spot ETF flows finally flipp...

Standard Chartered Says Bitcoin Bottomed Near $59,000 As Crypto Winter Ends
TL;DR Standard Chartered’s Geoffrey Kendrick reportedly says Bitcoin’s $59,000 area marked the cycle bottom. The note cites SpaceX...

Google Gemini AI Predicts Jaw-Dropping XRP Price For Next 90 Days
Google Gemini AI just put XRP back under the spotlight, predicting it is tightly wound for a major breakout toward $1.60 to $1.80...

North Korea declares denuclearization irreversibly terminated, raising stakes for crypto security
North Korea's stance heightens geopolitical tensions and underscores the urgent need for enhanced cybersecurity measures in the cr...

Elon Musk SpaceX AI Predicts Incredible Bitcoin Price For Next 30 Days
Here is the thing about capitulation calls. They only sound smart in hindsight. Right now, with Bitcoin price scraping along the l...

US forces shoot down Iranian attack drones near Strait of Hormuz, Bitcoin drops below $73K
Geopolitical tensions near vital oil routes can destabilize financial markets, highlighting the interconnectedness of global secur...