Ethereum Price On The Brink: 10% Drop Possible Toward $1,440
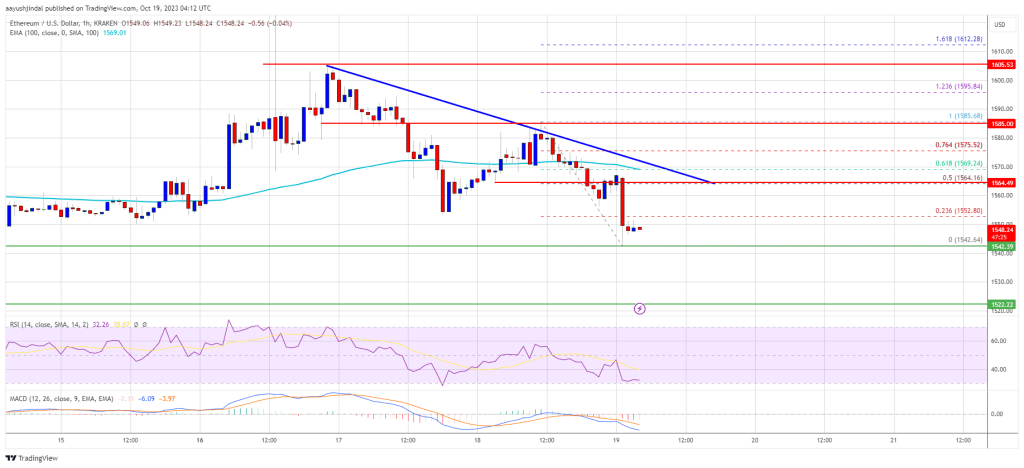
Ethereum price settled below the $1,565 support zone against the US dollar. ETH is accelerating lower and might drop toward the $1,440 support. Ethereum is gaining pace below the $1,550 support zone. The price is trading...

Ethereum price settled below the $1,565 support zone against the US dollar. ETH is accelerating lower and might drop toward the $1,440 support.
- Ethereum is gaining pace below the $1,550 support zone.
- The price is trading just below $1,565 and the 100-hourly Simple Moving Average.
- There is a connecting bearish trend line forming with resistance near $1,565 on the hourly chart of ETH/USD (data feed via Kraken).
- The pair remains at risk of more downsides toward the $1,440 support.
Ethereum started a fresh decline and settled below the $1,600 pivot level. ETH traded below the $1,565 and $1,550 support levels, like Bitcoin.
A low is formed near $1,542 and the price is now consolidating losses. The current price action suggests high chances of more losses. There is also a connecting bearish trend line forming with resistance near $1,565 on the hourly chart of ETH/USD.
Ethereum is now trading just below $1,565 and the 100-hourly Simple Moving Average. On the upside, the price is facing resistance near the $1,565 level and the trend line. The 50% Fib retracement level of the downward move from the $1,585 swing high to the $1,542 low is also near the trend line.
The first major resistance is near the $1,575 zone or the 76.4% Fib retracement level of the downward move from the $1,585 swing high to the $1,542 low.
Source: ETHUSD on TradingView.com
A close above the $1,575 resistance might start a steady increase. In the stated case, Ether could start a recovery wave toward the $1,600 resistance. Any more gains might open the doors for a move toward $1,665.
More Losses in ETH?If Ethereum fails to clear the $1,565 resistance, it could start another decline. Initial support on the downside is near the $1,540 level.
The next key support is $1,520. A downside break below the $1,520 support might spark sharp bearish moves. In the stated case, the price could drop toward the $1,440 level. Any more losses may perhaps send Ether toward the $1,350 level.
Technical Indicators
Hourly MACD – The MACD for ETH/USD is gaining momentum in the bearish zone.
Hourly RSI – The RSI for ETH/USD is now below the 50 level.
Major Support Level – $1,520
Major Resistance Level – $1,565
Original source
Read on NewsBTCRelated market context

Uranium Holds Above $85 as Mining ETF Rebounds From June Sell-Off
The latest charts display that the market is divided into stable physical prices and uranium shares trying to regain momentum afte...

Tether USDT Briefly Overtakes Ethereum in Market Cap: A $187B Wake-Up Call
For a few hours, earlier this week, Tether USDT stablecoin held a higher market cap than Ethereum, the first time that has happene...

Google Gemini AI Predicts Jaw-Dropping XRP Price For Next 90 Days
Google Gemini AI just put XRP back under the spotlight, predicting it is tightly wound for a major breakout toward $1.60 to $1.80...

Elon Musk SpaceX AI Predicts Incredible Bitcoin Price For Next 30 Days
Here is the thing about capitulation calls. They only sound smart in hindsight. Right now, with Bitcoin price scraping along the l...

Standard Chartered Says Bitcoin Bottomed Near $59,000 As Crypto Winter Ends
TL;DR Standard Chartered’s Geoffrey Kendrick reportedly says Bitcoin’s $59,000 area marked the cycle bottom. The note cites SpaceX...

US forces shoot down Iranian attack drones near Strait of Hormuz, Bitcoin drops below $73K
Geopolitical tensions near vital oil routes can destabilize financial markets, highlighting the interconnectedness of global secur...