Ethereum Price Plunge To $1,150 On The Horizon As Bulls Show Weak Hands
Ethereum declined below the $1,300 support against the US Dollar. ETH is showing bearish signs and there is a risk of a more losses towards $1,200 or even $1,150. Ethereum started a fresh decline below the $1,350 and $1,...

Ethereum declined below the $1,300 support against the US Dollar. ETH is showing bearish signs and there is a risk of a more losses towards $1,200 or even $1,150.
- Ethereum started a fresh decline below the $1,350 and $1,320 support levels.
- The price is now trading below $1,300 and the 100 hourly simple moving average.
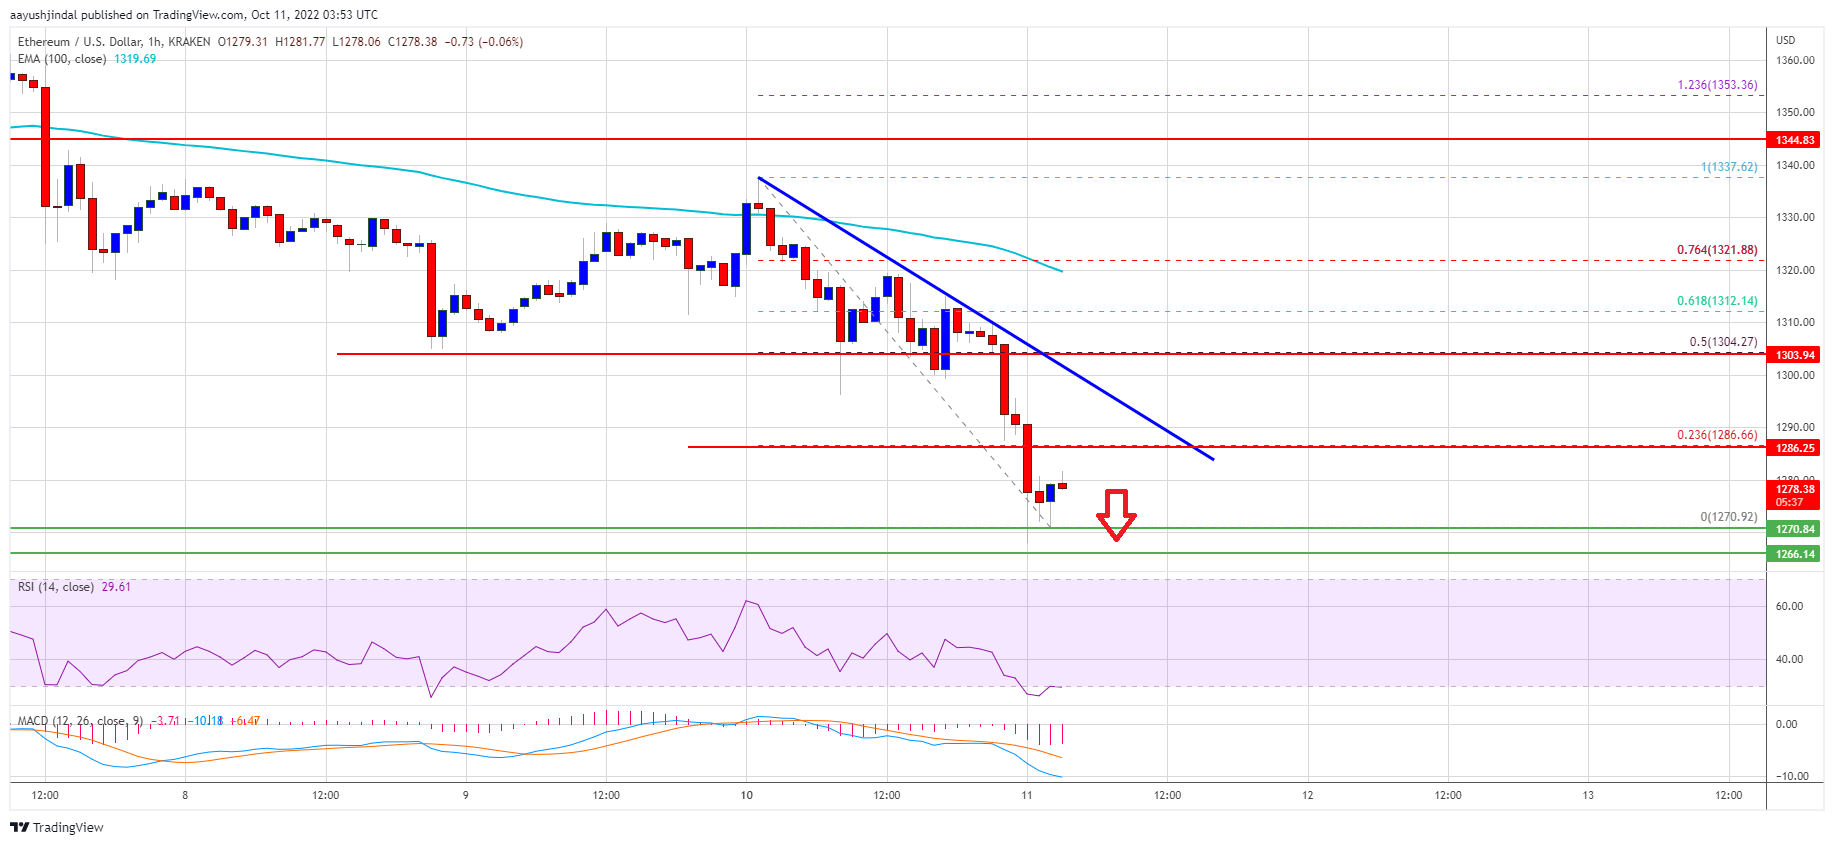
- There is a key bearish trend line forming with resistance near $1,285 on the hourly chart of ETH/USD (data feed via Kraken).
- The pair could continue to move down if it stays below the $1,300 pivot level.
Ethereum struggled to recover above the $1,340 and $1,350 resistance levels. ETH started a fresh decline and traded below the $1,300 support zone.
There was a move below the $1,280 support level and the price settled below the 100 hourly simple moving average. Ether price traded as low as $1,270 and is currently consolidating losses. An immediate resistance on the upside is near the $1,280 level.
The first major resistance is near the $1,285 level. There is also a key bearish trend line forming with resistance near $1,285 on the hourly chart of ETH/USD. The trend line is near the 23.6% Fib retracement level of the recent decline from the $1,337 swing high to $1,276 low.
If there is an upside break above the trend line, ethereum price might rise towards the $1,300 resistance. It is near the 50% Fib retracement level of the recent decline from the $1,337 swing high to $1,276 low.
Source: ETHUSD on TradingView.com
A clear break above $1,300 could send the price further higher. The next major resistance could be near the $1,320 level and the 100 hourly simple moving average, above which the price could revisit $1,350.
More Losses in ETH?If ethereum fails to climb above the $1,300 resistance, it could continue to move down. An initial support on the downside is near the $1,280 level.
The next major support is near the $1,255 level. A downside break below the $1,255 might increase selling pressure. In the stated case, ether price may perhaps decline towards the $1,200 level. Any more losses might send the price towards $1,150.
Technical Indicators
Hourly MACD – The MACD for ETH/USD is now gaining momentum in the bearish zone.
Hourly RSI – The RSI for ETH/USD is now below to the 50 level.
Major Support Level – $1,255
Major Resistance Level – $1,320
Original source
Read on NewsBTCRelated market context

Uranium Holds Above $85 as Mining ETF Rebounds From June Sell-Off
The latest charts display that the market is divided into stable physical prices and uranium shares trying to regain momentum afte...

Tether USDT Briefly Overtakes Ethereum in Market Cap: A $187B Wake-Up Call
For a few hours, earlier this week, Tether USDT stablecoin held a higher market cap than Ethereum, the first time that has happene...

Elon Musk’s trillionaire status puts his net worth above crypto’s entire market cap outside Bitcoin
Elon Musk has become the first person in modern history to amass a personal net worth exceeding $1 trillion, crossing the historic...

Standard Chartered Says Bitcoin Bottomed Near $59,000 As Crypto Winter Ends
TL;DR Standard Chartered’s Geoffrey Kendrick reportedly says Bitcoin’s $59,000 area marked the cycle bottom. The note cites SpaceX...

Crypto Today: Bitcoin ETF Rumours, Ethereum Strength, and Mining Heat for Canadian Homes
Bitcoin ETF rumours lift sentiment, Ethereum recaptures $3,800, and North Vancouver uses mining heat for homes. Coinbase unveils p...

Google Gemini AI Predicts Jaw-Dropping XRP Price For Next 90 Days
Google Gemini AI just put XRP back under the spotlight, predicting it is tightly wound for a major breakout toward $1.60 to $1.80...