Ethereum Price Plunge To $2K Imminent as Key Support Line Crumbles
Ethereum price extended losses and tested the $2,150 support. ETH is struggling to recover and might continue to move down toward the $2,000 support zone. Ethereum started a fresh decline below the $2,350 and $2,250 leve...

Ethereum price extended losses and tested the $2,150 support. ETH is struggling to recover and might continue to move down toward the $2,000 support zone.
- Ethereum started a fresh decline below the $2,350 and $2,250 levels.
- The price is trading below $2,250 and the 100-hourly Simple Moving Average.
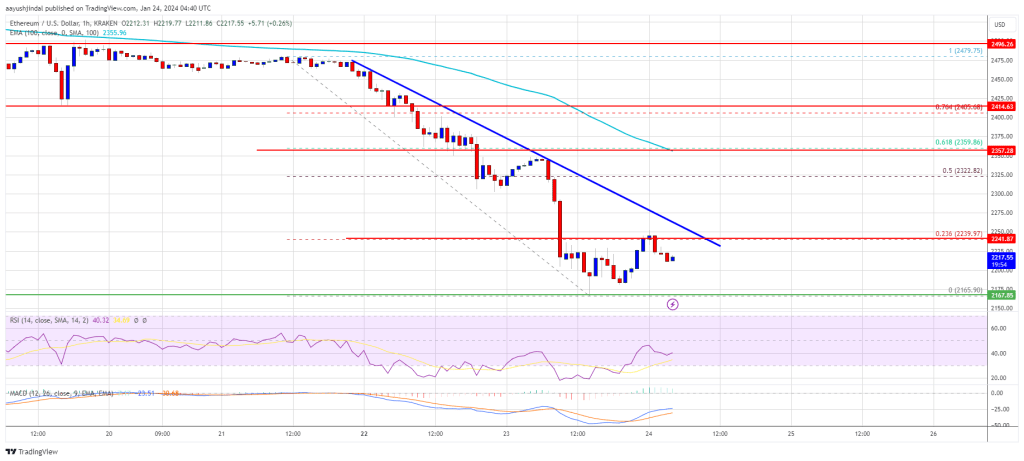
- There is a key bearish trend line forming with resistance near $2,240 on the hourly chart of ETH/USD (data feed via Kraken).
- The pair attempt a fresh increase if it clears the $2,240 and $2,280 levels.
Ethereum price remained in a bearish zone below the $2,400 pivot level. ETH extended its decline and traded below the $2,250 support level, like Bitcoin.
It even spiked below the $2,000 level. A new weekly low was formed near $2,165 and the price is now consolidating losses. There was a minor increase above the $2,220 level. The price tested the 23.6% Fib retracement level of the downward wave from the $2,480 swing high to the $2,165 low.
Ethereum is now trading below $2,250 and the 100-hourly Simple Moving Average. On the upside, the price is facing resistance near the $2,240 level. There is also a key bearish trend line forming with resistance near $2,240 on the hourly chart of ETH/USD.
The next hurdle could be $2,280, above which the price could aim for a decent recovery. The next major resistance is now near $2,360 or the 61.8% Fib retracement level of the downward wave from the $2,480 swing high to the $2,165 low.
Source: ETHUSD on TradingView.com
A clear move above the $2,360 level might start a decent increase. In the stated case, the price could rise toward the $2,415 level. Any more gains might send the price toward the $2,550 zone.
More Losses in ETH?If Ethereum fails to clear the $2,440 resistance, it could start another decline. Initial support on the downside is near the $2,200 level.
The next key support could be the $2,165 zone. A downside break below the $2,165 support might send the price further lower. In the stated case, Ether could test the $2,120 support. Any more losses might send the price toward the $2,000 level.
Technical Indicators
Hourly MACD – The MACD for ETH/USD is gaining momentum in the bearish zone.
Hourly RSI – The RSI for ETH/USD is now below the 50 level.
Major Support Level – $2,165
Major Resistance Level – $2,480
Original source
Read on NewsBTCRelated market context

Ethereum Price Prediction: ETH is Still Below Its 200 Week SMA, and Tom Lee Buying Spree Might End Soon
Ethereum price is trading above $1,700 after running for 5% today, and even our prediction model is calling for more leg higher. H...

BTC News Today: Bitcoin Climbs Toward $66K as Trump Reveals US-Iran Peace Deal
The renewed geopolitical optimism helped improve risk sentiment across financial markets, pushing Bitcoin back toward the $66,000...

Bitcoin Stabilizes Near Key Zone, But Glassnode Warns Capital Flows Remain Weak
Bitcoin’s rebound from the $60,000 area has given bulls something to work with, but Glassnode’s latest market read suggests the re...

Ethereum News: Last Chance to Buy Ethereum Under $2K? ETH USD Powers Up After Hormuz Peace Deal
In the latest Ethereum News, Ethereum ETH Price is trading at $1,739 up 4% in 24 hours, as risk assets catch a bid following the H...

XRP Price Analysis: Ripple Token Eyes 10% Gain with Flashing Bullish Pattern and ETF Inflows
XRP price posts 9% moves today from low $1.1 to $1.24, with a prediction that it could go even higher. Two independent tailwinds a...

Bitcoin Price Prediction: Bank of Japan Rate Hike and Piling Yen Shorts Threaten BTC
Bitcoin price is back above $65,000, gaining more than $3,000 in a day, although Washington helps, news from the other side of the...