Ethereum Price Plunges After Rejection, Are Bears Back In Action?
Ethereum price gained bearish momentum below $1,620 against the US Dollar. ETH is showing bearish signs and might decline further toward $1,540. Ethereum declined further below the $1,600 support zone. The price is tradi...

Ethereum price gained bearish momentum below $1,620 against the US Dollar. ETH is showing bearish signs and might decline further toward $1,540.
- Ethereum declined further below the $1,600 support zone.
- The price is trading below $1,620 and the 100-hourly Simple Moving Average.
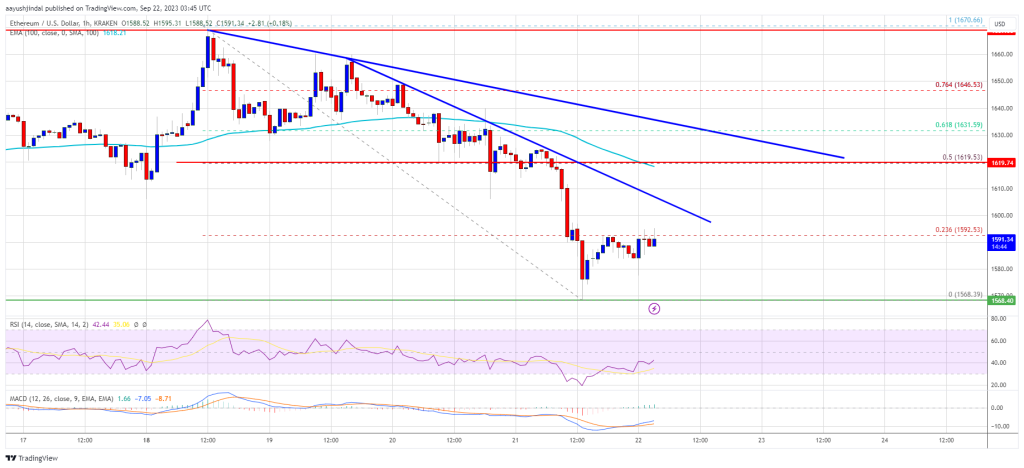
- There are two bearish trend lines forming with resistance near $1,600 and $1,620 on the hourly chart of ETH/USD (data feed via Kraken).
- The pair could continue to move down and test the $1,540 support in the short term.
Ethereum’s price started a fresh decline from the $1,660 and $1,670 resistance levels. ETH declined below the $1,620 support level to enter a bearish zone and underperformed Bitcoin.
The bears even pushed the price below the $1,600 support and the 100-hourly Simple Moving Average. A low is formed near $1,568 and the price is now attempting a recovery wave. There was a move above the $1,580 level. The price is testing the 23.6% Fib retracement level of the recent decline from the $1,660 swing high to the $1,568 low.
Ether is now trading below $1,620 and the 100-hourly Simple Moving Average. There are also two bearish trend lines forming with resistance near $1,600 and $1,620 on the hourly chart of ETH/USD.
On the upside, the price might face resistance near the $1,600 level and the first trend line. The next resistance is near the $1,610 level, the second trend line, and the 100-hourly Simple Moving Average. The trend line is also near the 50% Fib retracement level of the recent decline from the $1,660 swing high to the $1,568 low.
Source: ETHUSD on TradingView.com
A close above the $1,620 resistance might send the price toward the $1,650 resistance. The next major barrier is near the $1,660 level. A close above the $1,660 level might send Ethereum further higher toward $1,750.
More Losses in ETH?If Ethereum fails to clear the $1,620 resistance, it could start another decline. Initial support on the downside is near the $1,565 level.
The next key support is $1,540. A downside break below $1,540 might accelerate losses. In the stated case, there could be a drop toward the $1,440 level in the coming days.
Technical Indicators
Hourly MACD – The MACD for ETH/USD is losing momentum in the bearish zone.
Hourly RSI – The RSI for ETH/USD is now below the 50 level.
Major Support Level – $1,540
Major Resistance Level – $1,620
Original source
Read on NewsBTCRelated market context

Uranium Holds Above $85 as Mining ETF Rebounds From June Sell-Off
The latest charts display that the market is divided into stable physical prices and uranium shares trying to regain momentum afte...

Tether USDT Briefly Overtakes Ethereum in Market Cap: A $187B Wake-Up Call
For a few hours, earlier this week, Tether USDT stablecoin held a higher market cap than Ethereum, the first time that has happene...

US forces shoot down Iranian attack drones near Strait of Hormuz, Bitcoin drops below $73K
Geopolitical tensions near vital oil routes can destabilize financial markets, highlighting the interconnectedness of global secur...

XRP aims for $0.90 as ETF demand battles selling pressure from whales
XRP is trading at $1.11, down roughly 17% from its June opening, having set a new 2026 low on June 5 and shed $8 billion in market...

Google Gemini AI Predicts Jaw-Dropping XRP Price For Next 90 Days
Google Gemini AI just put XRP back under the spotlight, predicting it is tightly wound for a major breakout toward $1.60 to $1.80...

Elon Musk SpaceX AI Predicts Incredible Bitcoin Price For Next 30 Days
Here is the thing about capitulation calls. They only sound smart in hindsight. Right now, with Bitcoin price scraping along the l...